The Landsat archive has added its 8 millionth scene.
This stunning image was captured by Landsat 8 on July 28, 2018. It shows the coastline of Nordaustlandet, the second-largest island in Norway’s Svalbard archipelago.

Official websites use .gov
A .gov website belongs to an official government organization in the United States.
Secure .gov websites use HTTPS
A lock () or https:// means you’ve safely connected to the .gov website. Share sensitive information only on official, secure websites.
Landsat 8 celebrates its tenth anniversary this week on Saturday, February 11, 2023. The technology of the satellite and its instruments, revolutionary in 2013, continues to provide important and timely data for scientific observation of the Earth’s land surfaces. Landsat 8 continues to image the Earth with Landsat 9 and Landsat 7.
“Over the past 10 years, Landsat 8 has provided highly reliable scientific information in support of land management priorities around the planet that include the protection and preservation of life, property and natural resources,” said Pete Doucette, Acting Director of the Earth Resources Observation and Science (EROS) Center in Sioux Falls, South Dakota.
With just over 2.5 million images, Landsat 8 accounts for a more than 23 percent of the available scenes in the USGS Landsat archive. Over the past decade, Landsat 8 has completed over 51,000 orbits around our planet. The earth observing satellite has traveled over 1.4 billion miles, more than seven times to the sun and back.
Landsat 8’s first image captured the area where the Great Plains and Rocky Mountains meet in Colorado. The natural-color image shows the coniferous forest of the mountains coming down to the plains. Boulder, Colorado, sits in the middle of the image. Landsat 8’s Operational Land Imager (OLI) sensor was developed and built here by the Ball Aerospace & Technologies Corporation.
Ten years later the areas have changed. Since 1959, Boulder has limited the city’s residential growth to 1% annually. This decision slows urban sprawl, protecting the nearby mountains and local wildlife. New white roofs in the city center are likely commercial buildings. Today, top employers in the region include the University of Colorado Boulder, Ball Aerospace, Google, and the National Oceanic and Atmospheric Administration (NOAA). Because of restricted housing growth, many citizens commute from nearby cities into Boulder.


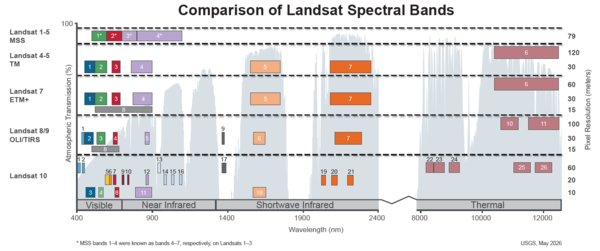
Once fully operational in 2013, Landsat 8 moved into the orbit left empty by the lowering of Landsat 5. The improved instruments on the new satellite brought an expanded spectral range with a total of eleven bands. The OLI measures visible, near infrared, and shortwave infrared portions of the light spectrum. Like Landsat 7, Landsat 8’s higher resolution panchromatic band brought the ability to sharpen magnified images.
In addition to new bands, OLI brought increased light sensitivity to Landsat images. The instrument uses 16-bit dynamic range, an improvement from 8-bit instruments on Landsat 1-7. As a result, Landsat 8 provides more precise radiometric data and better signal to noise ratio. Characterizing land cover states and conditions improved overall.
Also aboard Landsat 8, the Thermal Infrared Sensor (TIRS) measures land surface temperatures. The TIRS introduced two thermal channels, compared the single channels on previous Landsat 7 and Landsat 4-5 satellites.
Below are some of Landsat 8’s most iconic moments.
Thirty-five years ago, this remote piece of the Sahara Desert in Egypt stood empty. Known as Egypt-2, the location was chosen as a calibration site by Landsat engineers to verify incoming data. Calibration sites ensure Landsat imagery entering the archive is consistent and accurate. Changes observed in the imagery often indicate issues with sensors aboard.
These small green circles, however, aren’t from the sensor. They are center pivot irrigation fields. Under the desert sits a large aquifer. The groundwater is pumped to the fields to help produce one-third of Egypt’s wheat crop.
For over fifty years, Landsat satellites have observed fire growth and forest recovery. In 2018, Landsat 8 captured imagery of California’s deadliest wildfire, the Camp Fire, hours after it started. The Camp Fire burned over 100,000 acres in just two days.
Fire scientists and firefighters can use satellite imagery to track a fire’s behavior and size. Landsat 8’s shortwave infrared and thermal bands are particularly helpful to see past smoke and other aerosols.
After the flames are quelled, researchers use Landsat data to plan recovery efforts and monitory damaged areas.
Decades of consistent data from Landsat help scientists monitor the growth of urban areas in a world where more than half of the population lives in cities like Las Vegas.

Toxic algal blooms are increasingly present in freshwater lakes around the world. In 2017, Landsat 8 captured this image of Lake Erie in full green display.
These harmful blooms are a public health concern. The toxins in the algae irritate skin and can damage livers. Water is not safe to drink and swim. A range of activities are affected by the blooms including drinking water, agriculture, fishing, and recreation. Scientists use Landsat data to further understand what causes the algal blooms.
Urban development appears as green and purple in this series of Landsat images. On land covered by asphalt, concrete, rooftops, and other man-made constructs, rainwater does not soak into the ground. Instead, it runs off. Landsat-based mapping of land cover and land use is valuable to urban growth studies and modeling to show how increased water runoff affects groundwater quality, as well as the pressure on resources caused by rapidly increasing populations.
Mountain pine beetles are attacking the Ponderosa pine forests in the Black Hills of South Dakota. Although the size of a grain of rice, the beetles’ impact on the forests are clearly visible.
The washed-out pink color indicates large areas of standing dead or damaged trees. Cold winters normally kill beetle eggs and keep the population down. Recent winters have been warmer than normal. Prolonged dry conditions in the early 2000s also weakened the trees and made them easier for the beetles to attack. These factors together led to a massive epidemic. Current Landsat imagery still shows the degraded forest.
In 2022, Utah’s Great Salt Lake made headlines for record low water levels. Many of the lake’s islands are now walkable from the mainland, unheard of in previous decades. During below-average years, water levels drop and salinity rises. This causes the shoreline to recede and the wetlands to dry up. When precipitation is high, lake levels rise and salinity drops. The shoreline expands and wetlands get covered by salt water which is harmful to sensitive plants and destroys wildlife habitats. Regional resource management officials used the Landsat satellite data to monitor, on a regular basis, the conditions and variable changes in the lake region.


February 11 will mark the 5th anniversary of the launch of Landsat 8! Since 2013, over 1.1 million scenes have been acquired, adding to the Landsat archive which started almost 45 years ago, and continue to help support studies in agriculture, forest and water quality/use/management, natural disasters, and land change. The Landsat Program is a series of Earth-observing satellites co-managed by...

The Landsat archive has added its 8 millionth scene.
This stunning image was captured by Landsat 8 on July 28, 2018. It shows the coastline of Nordaustlandet, the second-largest island in Norway’s Svalbard archipelago.
The Landsat archive has added its 8 millionth scene.
This stunning image was captured by Landsat 8 on July 28, 2018. It shows the coastline of Nordaustlandet, the second-largest island in Norway’s Svalbard archipelago.

USGS Scientists John Dwyer and Tom Loveland from EROS discuss the major accomplishments of Landsat 8 as it reaches it's 5 year design life. The Landsat program started in 1972, and has a bright future thanks to these extraordinary satellites.
USGS Scientists John Dwyer and Tom Loveland from EROS discuss the major accomplishments of Landsat 8 as it reaches it's 5 year design life. The Landsat program started in 1972, and has a bright future thanks to these extraordinary satellites.

Landsat 8 collects it's 1 millionth scene. See it for yourself!
Landsat 8 collects it's 1 millionth scene. See it for yourself!

The Earth Resources Observation and Science (EROS) Center has created a video animation describing how Landsat 8 orbits the Earth. The video explains the 16-day cycle for capturing imagery of the entire world.
The Earth Resources Observation and Science (EROS) Center has created a video animation describing how Landsat 8 orbits the Earth. The video explains the 16-day cycle for capturing imagery of the entire world.

Have you ever wondered what all the parts of a satellite do? This video identifies a few of the main components onboard Landsat 8 and tells you about their role in flying the satellite and capturing images of the Earth's surface below. Learn more about USGS Landsat.
Have you ever wondered what all the parts of a satellite do? This video identifies a few of the main components onboard Landsat 8 and tells you about their role in flying the satellite and capturing images of the Earth's surface below. Learn more about USGS Landsat.
February 11 will mark the 5th anniversary of the launch of Landsat 8! Since 2013, over 1.1 million scenes have been acquired, adding to the Landsat archive which started almost 45 years ago, and continue to help support studies in agriculture, forest and water quality/use/management, natural disasters, and land change. The Landsat Program is a series of Earth-observing satellites co-managed by...
The Landsat archive has added its 8 millionth scene.
This stunning image was captured by Landsat 8 on July 28, 2018. It shows the coastline of Nordaustlandet, the second-largest island in Norway’s Svalbard archipelago.
The Landsat archive has added its 8 millionth scene.
This stunning image was captured by Landsat 8 on July 28, 2018. It shows the coastline of Nordaustlandet, the second-largest island in Norway’s Svalbard archipelago.
USGS Scientists John Dwyer and Tom Loveland from EROS discuss the major accomplishments of Landsat 8 as it reaches it's 5 year design life. The Landsat program started in 1972, and has a bright future thanks to these extraordinary satellites.
USGS Scientists John Dwyer and Tom Loveland from EROS discuss the major accomplishments of Landsat 8 as it reaches it's 5 year design life. The Landsat program started in 1972, and has a bright future thanks to these extraordinary satellites.
Landsat 8 collects it's 1 millionth scene. See it for yourself!
Landsat 8 collects it's 1 millionth scene. See it for yourself!
The Earth Resources Observation and Science (EROS) Center has created a video animation describing how Landsat 8 orbits the Earth. The video explains the 16-day cycle for capturing imagery of the entire world.
The Earth Resources Observation and Science (EROS) Center has created a video animation describing how Landsat 8 orbits the Earth. The video explains the 16-day cycle for capturing imagery of the entire world.
Have you ever wondered what all the parts of a satellite do? This video identifies a few of the main components onboard Landsat 8 and tells you about their role in flying the satellite and capturing images of the Earth's surface below. Learn more about USGS Landsat.
Have you ever wondered what all the parts of a satellite do? This video identifies a few of the main components onboard Landsat 8 and tells you about their role in flying the satellite and capturing images of the Earth's surface below. Learn more about USGS Landsat.