
WaterMAP, or Water Monitoring Above the Planet, is an interactive web application that brings together surface water observations across the U.S. The application allows users to explore water conditions over time using both remotely sensed satellite and field measured data.
WaterMAP integrates satellite-derived observations, onsite monitoring stations, and spatial hydrography data to provide a comprehensive view of inland water conditions, which includes rivers, lakes, reservoirs, and the land surface. By combining these datasets, WaterMAP enables users to explore water quantity, water quality, and related spatial features in one convenient platform.
Expanding water data beyond monitoring locations
Satellite observation of water bodies is a new capability that has expanded rapidly in recent years. Satellite observations offer the advantage of covering wide areas and monitoring remote or hazardous areas where ground monitoring stations are sparse. WaterMAP displays and disseminates these satellite observations along with many ground observations for comparison. The point-based hydrologic observations have been collected for decades, or even centuries in some cases, from monitoring stations located at rivers and lakes. These monitoring stations provide valuable water information at a point, often in great temporal detail. By combining both in one app, WaterMAP provides comprehensive and value-rich water information for the the lower 48 United States and Alaska.
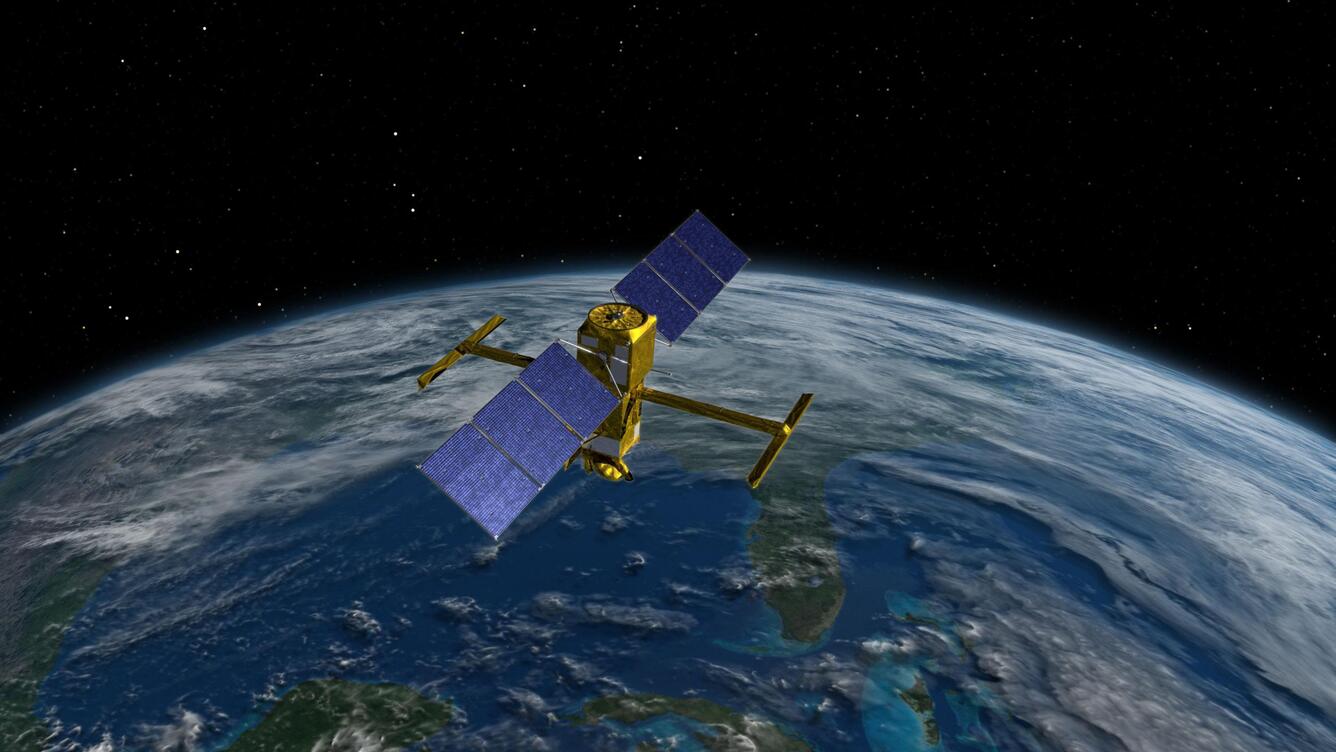
"Satellites reveal a new view of Earth’s water from space." - Surface Water and Ocean Topography (SWOT) Hydrology Lead, Tamlin Pavelsky, NASA
WaterMAP can be used to explore water levels, water temperatures, streamflows, chlorophyll concentrations, and more. By showing both satellite and ground monitoring data, WaterMAP expands both the number of waterbodies monitored and the density of information available within a given waterbody. For example, WaterMAP provides satellite-based measurements of water level up and down a large stream or approximate chlorophyll and turbidity conditions throughout a waterbody.
History of WaterMAP
WaterMAP was created to address the need for expanded USGS water monitoring capabilities by making hydrologic remote sensing technology operational and available to a wide range of users.
Traditional USGS hydrologic monitoring is tied to discrete, on-the-ground locations, leaving large portions of watersheds unmonitored. With the largest streamgage network in the world, the USGS monitors over 12,000 gage locations in the U.S. Satellite-derived remote sensing products help bridge the spatial and temporal data gap between discrete gage locations, particularly in areas with limited gage-based monitoring such as Alaska. The interactive mapping tools and cutting-edge data content and display, available in WaterMAP, has enabled the USGS to provide critical information on our nation’s water resources, all in one integrated platform.
Funded by the Next Generation Water Observing System (NGWOS), WaterMAP’s dynamic online public interface delivers remotely sensed data and is designed to meet the needs of Water Science Centers and public agencies and cooperators. WaterMAP was developed by the USGS Full-Stack Science and Engineering (FUSE) team at the California Water Science Center.
WaterMAP data layers
WaterMAP brings the most promising remote sensing technologies from across the USGS together. The ability to easily visualize and interact with water data through WaterMAP vastly expands the spatial reach of hydrologic monitoring in the United States and supports further awareness, exploration, and adoption of satellite-derived datasets for making water management decisions in the U.S. In addition, aerial data from drones and airplanes may be added to future versions of WaterMAP. The follow is a brief overview of data layers currently available through WaterMAP.
Surface Water and Ocean Topography (SWOT) satellite data
Data from the Surface Water and Ocean Topography satellite (SWOT) within WaterMAP provide time series of water surface elevations for ~467,000 lakes and reservoirs and ~93,000 river miles, with estimates of water level spaced every 200 meters.
Dynamic Surface Water Extent (DSWE) Inundation Frequency
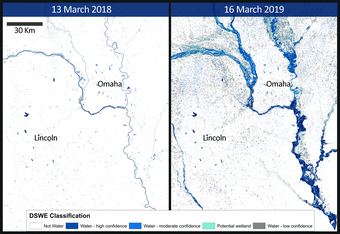
The Landsat Collection 2 (C2) Level-3 Dynamic Surface Water Extent (DSWE) product provides raster layers that represent levels of surface water inundation, per 30-meter –pixel, for the United States. DWSE helps display where water is on the landscape and how it changes over time, helping users identify trends and patters like seasonal flooding or drought (https://doi.org/10.5066/P9DPWBUS).
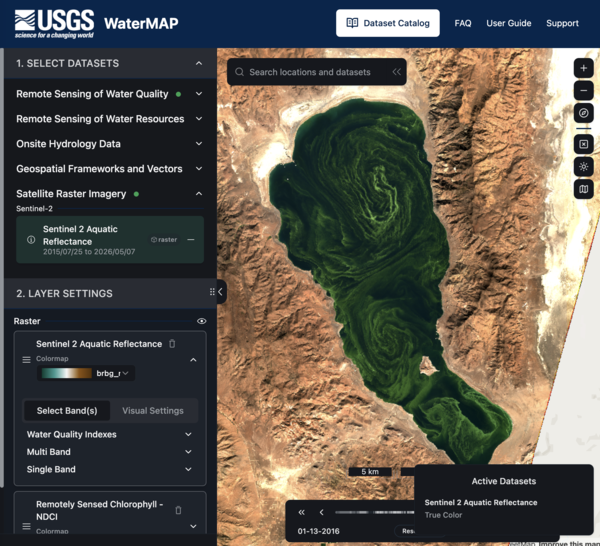
Sentinel-2 Aquatic Reflectance
This Sentinel-2 Aquatic Reflectance layer presents an aquatic reflectance product with 20-meter spatial resolution derived from Sentinel-2 satellite imagery for the lower 48 United States (https://doi.org/10.5066/P904243C). By showing how water surface reflectance changes over time, researchers can identify dynamics in water clarity and composition.
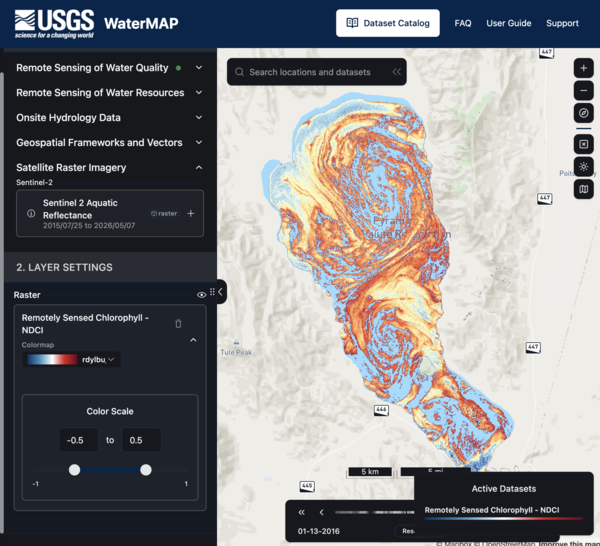
Remotely Sensed Chlorophyll – NDCI
The normalized difference chlorophyll index (NDCI) (https://doi.org/10.1016/j.rse.2011.10.016) is an uncalibrated index used to provide a relative comparison in approximate chlorophyll-a condition between waterbodies.
Remotely Sensed Waterbody Temperature
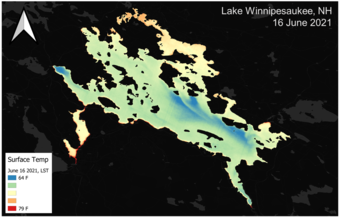
The Remotely Sensed Waterbody Temperature layer provides USGS Landsat surface temperatures extracted for waterbodies and the point farthest from shore (https://doi.org/10.5066/P13DZ7MP).
Lake Ice Cover
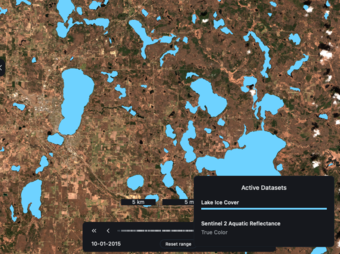
The Global Lake area, Climate, and Population (GLCP) dataset contains annual lake surface area for 1.42 million lakes with paired annual basin-level climate and population data (https://doi.org/10.6073/pasta/e0bf4571ca6cbfb81c3ed7caefc85fc6).
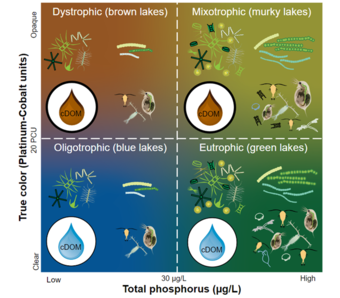
Lake Trophic State
Lake trophic state describes the overall health and productivity of a lake and integrates a lake's physical, chemical, and biological processes. The Lake Trophic State layer is the first compendium of lake trophic state for more than 56,000 lakes of at least 10 ha in size throughout the contiguous United States from 1984 through 2020 (https://doi.org/10.6073/PASTA/212A3172AC36E8DC6E1862F9C2522FA4). Lake Trophic States are derived from Landsat surface reflectance and lake morphometric data.
USGS Satellite-Estimated Discharge, Alaska Only
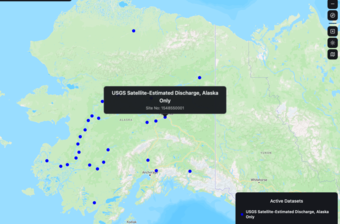
This dataset provides estimated Remote Sensing Streamflow (RSQ) data at selected river reaches in Alaska (https://doi.org/10.5066/P18WWJHU). The streamflow estimates are derived from satellite altimetry readings of river water levels provided by NASA Global Water Monitor (https://earth.gsfc.nasa.gov/gwm/river/Index); river widths derived from Landsat and Sentinel-2 satellite data, and Dynamic Surface Water Extent data (Jones, 2019); and a modified form of the Manning's streamflow equation (Bjerklie et al., 2018).
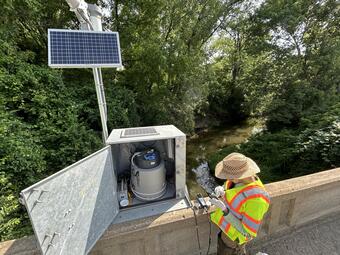
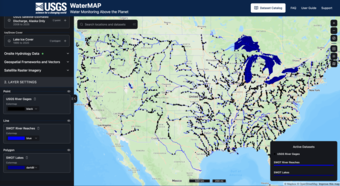
USGS River and Lake Gages
Water Data for the Nation provides near-real-time monitoring data for river and lake gages across the U.S. On WaterMAP, USGS gages near SWOT-observable lakes and streams are provided in two separate layers, the USGS Lake Gages and River Gages, respectively. The data collected at USGS monitoring locations serve several functions (including flood warning, water allocation, and recreation). The use of consistent methods enables data from the many gages to be combined, expanding the use and value of the data from every gage.
Spatial Reference Data
- NHD Waterbodies
- The National Hydrography Dataset (NHD) represents surface water features and the water drainage network of the United States. NHDWaterbodies, a subset of NHD, represents lakes, ponds, reservoirs, swamp/marsh (wetland), playas, estuaries, and ice mass with polygons.
- HydroLAKES
- The HydroLAKES data layer provides shoreline polygons for all lakes with a surface area of 10 hectares or greater (https://doi.org/10.1038/ncomms13603).
- Watershed Boundaries (HUCs)
- The USGS classifies watersheds with hydrologic unit codes (HUCs). HUCs represent catchments and river basins with a unique series of numbers with successively smaller hydrologic units nested within larger ones. These units help organize and analyze water data at different scales, from large river basins to smaller local watersheds.
For questions on WaterMAP, or to request any new features, datasets, or issues, please reach out to the WaterMAP support team at Watermap_Support@usgs.gov.
WaterMAP, or Water Monitoring Above the Planet, is an interactive web application that brings together surface water observations across the U.S. The application allows users to explore water conditions over time using both remotely sensed satellite and field measured data.
WaterMAP integrates satellite-derived observations, onsite monitoring stations, and spatial hydrography data to provide a comprehensive view of inland water conditions, which includes rivers, lakes, reservoirs, and the land surface. By combining these datasets, WaterMAP enables users to explore water quantity, water quality, and related spatial features in one convenient platform.
Expanding water data beyond monitoring locations
Satellite observation of water bodies is a new capability that has expanded rapidly in recent years. Satellite observations offer the advantage of covering wide areas and monitoring remote or hazardous areas where ground monitoring stations are sparse. WaterMAP displays and disseminates these satellite observations along with many ground observations for comparison. The point-based hydrologic observations have been collected for decades, or even centuries in some cases, from monitoring stations located at rivers and lakes. These monitoring stations provide valuable water information at a point, often in great temporal detail. By combining both in one app, WaterMAP provides comprehensive and value-rich water information for the the lower 48 United States and Alaska.
"Satellites reveal a new view of Earth’s water from space." - Surface Water and Ocean Topography (SWOT) Hydrology Lead, Tamlin Pavelsky, NASA
WaterMAP can be used to explore water levels, water temperatures, streamflows, chlorophyll concentrations, and more. By showing both satellite and ground monitoring data, WaterMAP expands both the number of waterbodies monitored and the density of information available within a given waterbody. For example, WaterMAP provides satellite-based measurements of water level up and down a large stream or approximate chlorophyll and turbidity conditions throughout a waterbody.
History of WaterMAP
WaterMAP was created to address the need for expanded USGS water monitoring capabilities by making hydrologic remote sensing technology operational and available to a wide range of users.
Traditional USGS hydrologic monitoring is tied to discrete, on-the-ground locations, leaving large portions of watersheds unmonitored. With the largest streamgage network in the world, the USGS monitors over 12,000 gage locations in the U.S. Satellite-derived remote sensing products help bridge the spatial and temporal data gap between discrete gage locations, particularly in areas with limited gage-based monitoring such as Alaska. The interactive mapping tools and cutting-edge data content and display, available in WaterMAP, has enabled the USGS to provide critical information on our nation’s water resources, all in one integrated platform.
Funded by the Next Generation Water Observing System (NGWOS), WaterMAP’s dynamic online public interface delivers remotely sensed data and is designed to meet the needs of Water Science Centers and public agencies and cooperators. WaterMAP was developed by the USGS Full-Stack Science and Engineering (FUSE) team at the California Water Science Center.
WaterMAP data layers
WaterMAP brings the most promising remote sensing technologies from across the USGS together. The ability to easily visualize and interact with water data through WaterMAP vastly expands the spatial reach of hydrologic monitoring in the United States and supports further awareness, exploration, and adoption of satellite-derived datasets for making water management decisions in the U.S. In addition, aerial data from drones and airplanes may be added to future versions of WaterMAP. The follow is a brief overview of data layers currently available through WaterMAP.
Surface Water and Ocean Topography (SWOT) satellite data
Data from the Surface Water and Ocean Topography satellite (SWOT) within WaterMAP provide time series of water surface elevations for ~467,000 lakes and reservoirs and ~93,000 river miles, with estimates of water level spaced every 200 meters.
Dynamic Surface Water Extent (DSWE) Inundation Frequency
The Landsat Collection 2 (C2) Level-3 Dynamic Surface Water Extent (DSWE) product provides raster layers that represent levels of surface water inundation, per 30-meter –pixel, for the United States. DWSE helps display where water is on the landscape and how it changes over time, helping users identify trends and patters like seasonal flooding or drought (https://doi.org/10.5066/P9DPWBUS).
Sentinel-2 Aquatic Reflectance
This Sentinel-2 Aquatic Reflectance layer presents an aquatic reflectance product with 20-meter spatial resolution derived from Sentinel-2 satellite imagery for the lower 48 United States (https://doi.org/10.5066/P904243C). By showing how water surface reflectance changes over time, researchers can identify dynamics in water clarity and composition.
Remotely Sensed Chlorophyll – NDCI
The normalized difference chlorophyll index (NDCI) (https://doi.org/10.1016/j.rse.2011.10.016) is an uncalibrated index used to provide a relative comparison in approximate chlorophyll-a condition between waterbodies.
Remotely Sensed Waterbody Temperature
The Remotely Sensed Waterbody Temperature layer provides USGS Landsat surface temperatures extracted for waterbodies and the point farthest from shore (https://doi.org/10.5066/P13DZ7MP).
Lake Ice Cover
The Global Lake area, Climate, and Population (GLCP) dataset contains annual lake surface area for 1.42 million lakes with paired annual basin-level climate and population data (https://doi.org/10.6073/pasta/e0bf4571ca6cbfb81c3ed7caefc85fc6).
Lake Trophic State
Lake trophic state describes the overall health and productivity of a lake and integrates a lake's physical, chemical, and biological processes. The Lake Trophic State layer is the first compendium of lake trophic state for more than 56,000 lakes of at least 10 ha in size throughout the contiguous United States from 1984 through 2020 (https://doi.org/10.6073/PASTA/212A3172AC36E8DC6E1862F9C2522FA4). Lake Trophic States are derived from Landsat surface reflectance and lake morphometric data.
USGS Satellite-Estimated Discharge, Alaska Only
This dataset provides estimated Remote Sensing Streamflow (RSQ) data at selected river reaches in Alaska (https://doi.org/10.5066/P18WWJHU). The streamflow estimates are derived from satellite altimetry readings of river water levels provided by NASA Global Water Monitor (https://earth.gsfc.nasa.gov/gwm/river/Index); river widths derived from Landsat and Sentinel-2 satellite data, and Dynamic Surface Water Extent data (Jones, 2019); and a modified form of the Manning's streamflow equation (Bjerklie et al., 2018).
USGS River and Lake Gages
Water Data for the Nation provides near-real-time monitoring data for river and lake gages across the U.S. On WaterMAP, USGS gages near SWOT-observable lakes and streams are provided in two separate layers, the USGS Lake Gages and River Gages, respectively. The data collected at USGS monitoring locations serve several functions (including flood warning, water allocation, and recreation). The use of consistent methods enables data from the many gages to be combined, expanding the use and value of the data from every gage.
Spatial Reference Data
- NHD Waterbodies
- The National Hydrography Dataset (NHD) represents surface water features and the water drainage network of the United States. NHDWaterbodies, a subset of NHD, represents lakes, ponds, reservoirs, swamp/marsh (wetland), playas, estuaries, and ice mass with polygons.
- HydroLAKES
- The HydroLAKES data layer provides shoreline polygons for all lakes with a surface area of 10 hectares or greater (https://doi.org/10.1038/ncomms13603).
- Watershed Boundaries (HUCs)
- The USGS classifies watersheds with hydrologic unit codes (HUCs). HUCs represent catchments and river basins with a unique series of numbers with successively smaller hydrologic units nested within larger ones. These units help organize and analyze water data at different scales, from large river basins to smaller local watersheds.
For questions on WaterMAP, or to request any new features, datasets, or issues, please reach out to the WaterMAP support team at Watermap_Support@usgs.gov.