
R/V Petrel surveying off Beach Haven, NJ during USGS FA 2018-001-FA
Images
Explore our planet through photography and imagery, including climate change and water all the way back to the 1800s when the USGS was surveying the country by horse and buggy.
Filter Total Items: 21356

R/V Petrel
R/V Petrel surveying off Beach Haven, NJ during USGS FA 2018-001-FA

Raindrop trace in StreamStats screenshot
Screenshot of raindrop trace in StreamStats
Screenshot of raindrop trace in StreamStats

Regulation in StreamStats screenshot
Regulation in StreamStats screenshot
Regulation in StreamStats screenshot
Releasing a loggerhead with radio tag
A loggerhead sea turtle, outfitted with a popoff ADL package (orange item on the turtle’s back), is released by New England Aquarium Biologist Nick Whitney.
A loggerhead sea turtle, outfitted with a popoff ADL package (orange item on the turtle’s back), is released by New England Aquarium Biologist Nick Whitney.

RV Petrel towing subbottom profiler
RV Petrel towing subbottom profiler (yellow raft) parallel to the beach to measure the thickness of sand offshore.
RV Petrel towing subbottom profiler (yellow raft) parallel to the beach to measure the thickness of sand offshore.

Salt Deposits (Gypsum)
Salt Deposits (Gypsum). (Source: Siim Sepp, http://www.sandatlas.org/)

Salt Impacted Field
Salt impacted field.
(Source: Colorado State University Extension, Fact Sheet No. 0.521)

Samples processing from an ecological monitoring and processing statio
Samples processing from an ecological monitoring and processing statioUSGS scientists retrieve and process samples from an ecological processing monitoring station. Each station includes a caged native mussel (shown attached to the buoy rope) and a sampler for measuring invertebrate consumers

Scientist surveying the behavior of birds at Pelican Island, Alabama
Scientist surveying the behavior of birds at Pelican Island, AlabamaScientist surveying the presence and behavior of birds at Pelican Island, Alabama. The CMHRP is working with personnel within the Ecosystems Mission Area on this project to identify how physical characteristics of barrier islands influence use by wintering shorebirds.

Scientists collect data on Pelican Island, Alabama
Scientists collect data on Pelican Island, AlabamaIn an effort spanning the Natural Hazards and Ecosystems Mission Areas, pilots from the Saint Petersburg and Woods Hole Coastal and Marine Science Centers collect imagery data using Unmanned Aerial System (UAS) while personnel from the Wetlands and Aquatic Research Center (WARC) conduct ground-based site surveys of Pelican Island, Alabama.
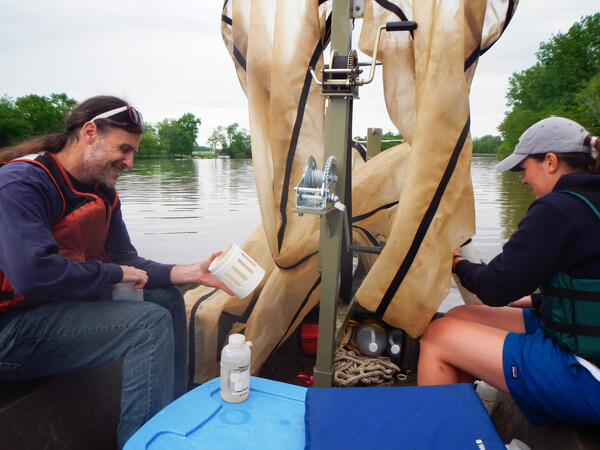
Scientists Looking for Grass Carp Larvae
Dr. Patrick Kocovsky and Maddy Tomczak, University of Toledo student, look for Grass Carp lavae and eggs in the Sandusky River using a set of bongo nets, so named because they resemble bongo drums. The nets are deployed one above the other so that one samples the surface water while the other samples deeper water.
Dr. Patrick Kocovsky and Maddy Tomczak, University of Toledo student, look for Grass Carp lavae and eggs in the Sandusky River using a set of bongo nets, so named because they resemble bongo drums. The nets are deployed one above the other so that one samples the surface water while the other samples deeper water.
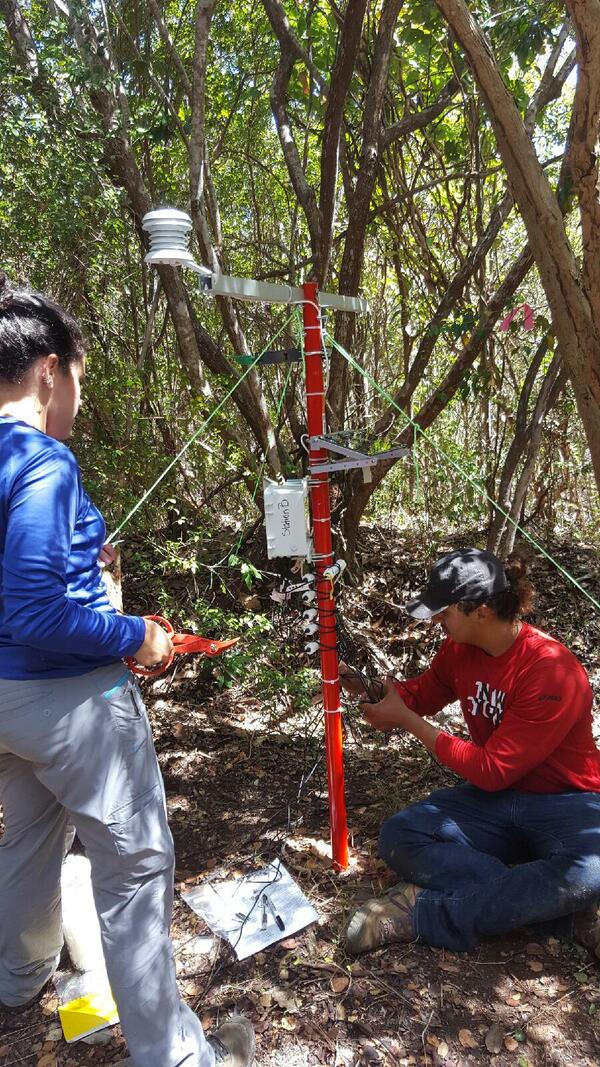
Scientists Monitoring Moisture in a Puerto Rican Forest
Scientists Monitoring Moisture in a Puerto Rican ForestDeploying environmental monitoring equipment in a mesic (between wet and dry) forest in western Puerto Rico. Characterizing fine-scale moisture gradients between dry and wet forests is critical to understand which habitats are likely to remain suitable for vulnerable amphibian species as the climate changes.

SEABOSS Collage
SEABed Observation and Sampling System (SEABOSS) (center image) and the MiniSEABOSS (right) designed for rapid, inexpensive, and effective collection of seabed imagery (photographs and video) as well sediment samples from the coastal/inner-continental shelf regions.
SEABed Observation and Sampling System (SEABOSS) (center image) and the MiniSEABOSS (right) designed for rapid, inexpensive, and effective collection of seabed imagery (photographs and video) as well sediment samples from the coastal/inner-continental shelf regions.

Sediment textures distribution from Nantucket and Marthas Vineyard, MA
Sediment textures distribution from Nantucket and Marthas Vineyard, MAThe distribution of sediment textures within the study area. The bottom-type classification is from Barnhardt and others (1998) and is based on 16 sediment classes. The classification is based on four sediment units that include gravel (G), mud (M), rock (R), and sand (S). If the texture is greater than 90 percent, it is labeled with a single letter.

Seismic Collage
Image showing a collage of examples of multi-channel and single-channel seismic data collected by the USGS, seismic equipment deployed from a research vessel, and seismic equipment on a research vessel. These data are critical to the CMG Program as they define the geology in marine and coastal environments.
Image showing a collage of examples of multi-channel and single-channel seismic data collected by the USGS, seismic equipment deployed from a research vessel, and seismic equipment on a research vessel. These data are critical to the CMG Program as they define the geology in marine and coastal environments.

Seismic instrument on pontoon floats deployed from the beach
Seismic instrument on pontoon floats deployed from the beachWe mount our seismic instrument on pontoon floats with wheels. This setup is deployed from the beach and eventually towed behind our survey vessel.
Seismic instrument on pontoon floats deployed from the beach
Seismic instrument on pontoon floats deployed from the beachWe mount our seismic instrument on pontoon floats with wheels. This setup is deployed from the beach and eventually towed behind our survey vessel.

ShakeAlert sensor station being serviced by USGS personnel
ShakeAlert sensor station being serviced by USGS personnelA USGS electronics technician performs maintenance on a ShakeAlert Earthquake Early Warning (EEW) sensor station, located in the San Francisco Bay Area. ShakeAlert station components include strong-motion accelerometers, solar panel and battery power systems, and communications & telemetry equipment for communication with the wider ShakeAlert network.
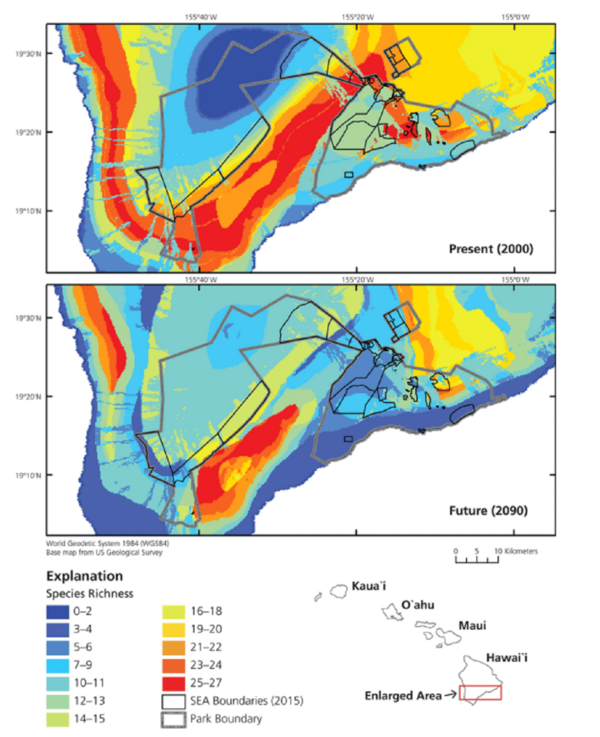
Species richness heat map
Native species richness (of the 29 species) using cool to warm colors to represent overlapping distributions of few to many species, respectively. The top panel shows that the present (year 2000) distribution of hotspots in the national park aligns well with the distribution of SEAs.
Native species richness (of the 29 species) using cool to warm colors to represent overlapping distributions of few to many species, respectively. The top panel shows that the present (year 2000) distribution of hotspots in the national park aligns well with the distribution of SEAs.

Stormwater runoff in the Albuquerque urban area, NMWSC
Stormwater runoff in the Albuquerque urban area, NMWSCStormwater runoff in the Albuquerque urban area, NMWSC
Stormwater runoff in the Albuquerque urban area, NMWSC
Stormwater runoff in the Albuquerque urban area, NMWSCStormwater runoff in the Albuquerque urban area, NMWSC

Sulfide minerals
Examples of sulfide minerals that occur at hydrothermal vents and are being studied by Amy Gartman: (left to right) sphalerite, an ore of zinc that often contains iron ([Zn,Fe]S); cubes of pyrite, rich in iron (FeS2); and covellite, containing copper and sulfur (CuS).The pyrite cubes are a little more than half an inch on a side.
Examples of sulfide minerals that occur at hydrothermal vents and are being studied by Amy Gartman: (left to right) sphalerite, an ore of zinc that often contains iron ([Zn,Fe]S); cubes of pyrite, rich in iron (FeS2); and covellite, containing copper and sulfur (CuS).The pyrite cubes are a little more than half an inch on a side.

Sunset State Beach webcams
USGS Pacific Coastal and Marine Science Center in Santa Cruz, California installed these two video cameras, pointed at the shoreline. The cameras collected imagery every half hour for 10 minutes, during daylight hours. The images are stored in the cloud and are used to study coastal variations through time, like wave, shoreline, and sandbar dynamics.
USGS Pacific Coastal and Marine Science Center in Santa Cruz, California installed these two video cameras, pointed at the shoreline. The cameras collected imagery every half hour for 10 minutes, during daylight hours. The images are stored in the cloud and are used to study coastal variations through time, like wave, shoreline, and sandbar dynamics.