
Events at the summit of Kīlauea over the past few weeks have dramatically reshaped Halema‘uma‘u, shown here in this aerial view, which looks west across the crater. The obvious flat surface (photo center) is the former Halema‘uma‘u crater floor, which has subsided at least 100 m (about 300 ft) during the past couple weeks.
Images
Explore our planet through photography and imagery, including climate change and water all the way back to the 1800s when the USGS was surveying the country by horse and buggy.
Filter Total Items: 21343

Kīlauea Volcano — Halema‘uma‘u Crater
Events at the summit of Kīlauea over the past few weeks have dramatically reshaped Halema‘uma‘u, shown here in this aerial view, which looks west across the crater. The obvious flat surface (photo center) is the former Halema‘uma‘u crater floor, which has subsided at least 100 m (about 300 ft) during the past couple weeks.

Kīlauea Volcano — Kapoho Bay
Aerial view of the ocean entry at Kapoho, where a lava delta about 250 acres in size is filling the bay. USGS image taken June 12, 2018, around 6:50 a.m. HST.
Aerial view of the ocean entry at Kapoho, where a lava delta about 250 acres in size is filling the bay. USGS image taken June 12, 2018, around 6:50 a.m. HST.

Kīlauea Volcano — Multiple Ocean Entries
The south side of the ocean entry was most active today, with many small streams of lava and corresponding steam plumes spread along a fairly broad section of the southern part of the delta. USGS image taken June 12, 2018, around 6:13 AM.
The south side of the ocean entry was most active today, with many small streams of lava and corresponding steam plumes spread along a fairly broad section of the southern part of the delta. USGS image taken June 12, 2018, around 6:13 AM.

Niagara River Carp
USGS technicians prepare to weigh a common carp during fish processing
USGS technicians prepare to weigh a common carp during fish processing

Kīlauea LERZ lava flows and fissures, June 11, 3:00 p.m.
Kīlauea LERZ lava flows and fissures, June 11, 3:00 p.m.Map as of 3:00 p.m. HST, June 11, 2018. Given the dynamic nature of Kīlauea's lower East Rift Zone eruption, with changing vent locations, fissures starting and stopping, and varying rates of lava effusion, map details shown here are accurate as of the date/time noted. Shaded purple areas indicate lava flows erupted in 1840, 1955, 1960, and 2014-2015.
Kīlauea summit activity
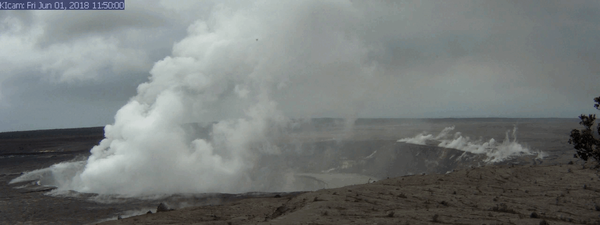
A series of wide-angle webcam images, captured by a camera in HVO's observation tower (https://volcanoes.usgs.gov/volcanoes/kilauea/multimedia_webcams.html) between June 1 and June 10, 2018, show ongoing subsidence around Halema‘uma‘u at the summit of Kīlauea in this animated GIF.
A series of wide-angle webcam images, captured by a camera in HVO's observation tower (https://volcanoes.usgs.gov/volcanoes/kilauea/multimedia_webcams.html) between June 1 and June 10, 2018, show ongoing subsidence around Halema‘uma‘u at the summit of Kīlauea in this animated GIF.

Kīlauea Volcano — Cracked Road at Summit
This 'warped-curb' crack, the largest in the parking area for the former Halema‘uma‘u overlook (closed since 2008), is one of many that have sliced the parking area into slices. Ballistics (blocks of solid rock) strewn across the area are visible in the foreground.
This 'warped-curb' crack, the largest in the parking area for the former Halema‘uma‘u overlook (closed since 2008), is one of many that have sliced the parking area into slices. Ballistics (blocks of solid rock) strewn across the area are visible in the foreground.

Kīlauea Volcano — Lava Channels (Fissure 8)
Aerial view of the fissure 8 lava channel on Kīlauea Volcano's lower East Rift Zone in the vicinity of the Kapoho cone, with fissure 8 fountains visible in the distance (upper left).
Aerial view of the fissure 8 lava channel on Kīlauea Volcano's lower East Rift Zone in the vicinity of the Kapoho cone, with fissure 8 fountains visible in the distance (upper left).

A photogrammetry survey of Kīlauea's summit by the U.S. Department ...
A photogrammetry survey of Kīlauea's summit by the U.S. Department ...A photogrammetry survey of Kīlauea's summit by the U.S. Department of Interior Unmanned Aircraft Systems' (UAS) Kīlauea response team show changes that have occurred at Halema‘uma‘u as of June 8. Cracks through the former overlook parking lot (bottom of image) wrap around the east margin of Halema‘uma‘u and extend to the north.

Kīlauea LERZ eruption
Fissure 8 continues to erupt vigorously, with lava streaming through a channel that reaches the ocean at Kapoho Bay. The width of the active part of the lava channel varies along its length, but ranges from about 100 to 300 meters (yards) wide. A clear view of the cinder-and-spatter cone that's building around the vent from ongoing lava fountains can be seen here.
Fissure 8 continues to erupt vigorously, with lava streaming through a channel that reaches the ocean at Kapoho Bay. The width of the active part of the lava channel varies along its length, but ranges from about 100 to 300 meters (yards) wide. A clear view of the cinder-and-spatter cone that's building around the vent from ongoing lava fountains can be seen here.

Kīlauea LERZ lava flows and fissures, June 10, 12:00 p.m.
Kīlauea LERZ lava flows and fissures, June 10, 12:00 p.m.Map as of 12:00 p.m. (noon) HST, June 10, 2018. Given the dynamic nature of Kīlauea's lower East Rift Zone eruption, with changing vent locations, fissures starting and stopping, and varying rates of lava effusion, map details shown here are accurate as of the date/time noted.

Kīlauea summit activity
Another explosion occurred at Halema‘uma‘u at 12:51 a.m. HST today, releasing energy equivalent to a magnitude-5.3 earthquake. Following the explosion, summit activity consisted mostly of passive degassing at Halema‘uma‘u, similar to what is shown in this image taken mid-morning.
Another explosion occurred at Halema‘uma‘u at 12:51 a.m. HST today, releasing energy equivalent to a magnitude-5.3 earthquake. Following the explosion, summit activity consisted mostly of passive degassing at Halema‘uma‘u, similar to what is shown in this image taken mid-morning.

Kīlauea Volcano — Fissure 8 Eruption

Kīlauea Volcano — Fissure 8 from a Distance
Distant view of Kīlauea Volcano's fissure 8 lava channel from HVO's early morning overflight on June 10, looking to the southeast. Bryson's cinder quarry is the brown patch just to the north of the channel.
Distant view of Kīlauea Volcano's fissure 8 lava channel from HVO's early morning overflight on June 10, looking to the southeast. Bryson's cinder quarry is the brown patch just to the north of the channel.

Kīlauea Volcano — Fissure 8 Lava Channel
A closer view of the fissure 8 lava channel with the cinderquarry more clearly visible in the foreground (bottom of photo). During this morning's overflight, HVO geologists observed no new breakouts of lava near this quarry.
A closer view of the fissure 8 lava channel with the cinderquarry more clearly visible in the foreground (bottom of photo). During this morning's overflight, HVO geologists observed no new breakouts of lava near this quarry.

Kīlauea Volcano — Kapoho Bay Ocean Entry Plume
The fissure 8 lava flow reaches the ocean at Kapoho Bay, where a lava delta has formed and continues to grow as lava enters the sea.
The fissure 8 lava flow reaches the ocean at Kapoho Bay, where a lava delta has formed and continues to grow as lava enters the sea.

Kīlauea Volcano — Lava Delta at Kapoho Bay
A closer aerial view of the lava delta forming at the Kapoho Bay ocean entry, where fissure 8 lava continued enter the ocean as of this morning. Laze (lava haze), an acidic white plume laced with tiny particles of volcanic glass, is produced by the ocean entry and creates an ongoing hazard that should be avoided.
A closer aerial view of the lava delta forming at the Kapoho Bay ocean entry, where fissure 8 lava continued enter the ocean as of this morning. Laze (lava haze), an acidic white plume laced with tiny particles of volcanic glass, is produced by the ocean entry and creates an ongoing hazard that should be avoided.

Kīlauea Volcano — Overflows from Fissure 8
Overflows of the upper fissure 8 lava channel this morning sent small flows of lava down the levee walls. These overflows did not extend far from the channel, so they posed no immediate threat to nearby areas.
Overflows of the upper fissure 8 lava channel this morning sent small flows of lava down the levee walls. These overflows did not extend far from the channel, so they posed no immediate threat to nearby areas.

Kīlauea Volcano — Summit Explosion (June 10, 2018)
Kīlauea Volcano — Summit Explosion (June 10, 2018)Another explosion occurred at Halema‘uma‘u at 12:51 a.m. HST today, releasing energy equivalent to a magnitude-5.3 earthquake.
Kīlauea Volcano — Summit Explosion (June 10, 2018)
Kīlauea Volcano — Summit Explosion (June 10, 2018)Another explosion occurred at Halema‘uma‘u at 12:51 a.m. HST today, releasing energy equivalent to a magnitude-5.3 earthquake.

Kīlauea Volcano — Topography of Halema`uma`u
A photogrammetry survey of Kīlauea's summit by the U.S. Department of Interior Unmanned Aircraft Systems' (UAS) Kīlauea response team show the topography of Halema‘uma‘u as of June 8.
A photogrammetry survey of Kīlauea's summit by the U.S. Department of Interior Unmanned Aircraft Systems' (UAS) Kīlauea response team show the topography of Halema‘uma‘u as of June 8.

Beach Haven, NJ
A renourished dune with protective vegetation planted on the barrier island in Beach Haven, NJ
A renourished dune with protective vegetation planted on the barrier island in Beach Haven, NJ