
Photo from 7AM helicopter overflight, hovering offshore and looking up the flowfront. Nearly all of the front was active and advancing; advance rates were estimated at an average of 250 feet/hour (76 m/hr), and as of 7AM the flow was 500 yards (457 m) from the ocean.
Images
Explore our planet through photography and imagery, including climate change and water all the way back to the 1800s when the USGS was surveying the country by horse and buggy.
Filter Total Items: 21343

Kīlauea Volcano — Advancing Flow
Photo from 7AM helicopter overflight, hovering offshore and looking up the flowfront. Nearly all of the front was active and advancing; advance rates were estimated at an average of 250 feet/hour (76 m/hr), and as of 7AM the flow was 500 yards (457 m) from the ocean.

Kīlauea Volcano — Advancing Lava Flow
Overflight photo at 7AM HST from offshore looking up the flowfront. Nearly all of the front was active and advancing/spreading.
Overflight photo at 7AM HST from offshore looking up the flowfront. Nearly all of the front was active and advancing/spreading.
Kīlauea Volcano — Halema‘uma‘u Crater Slumping Animation
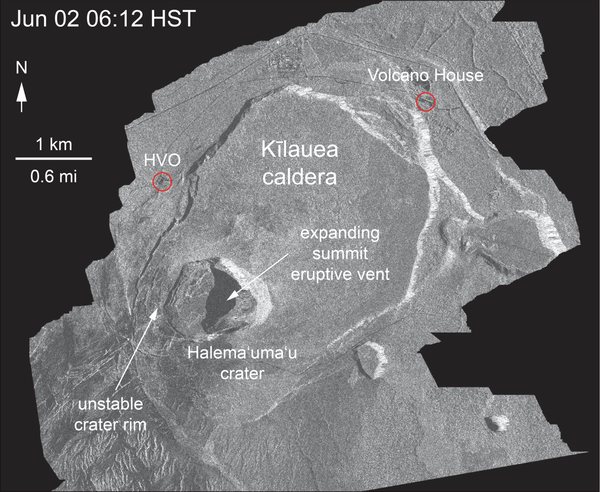
Kīlauea Volcano — Halema‘uma‘u Crater Slumping AnimationThis animated GIF shows a sequence of radar amplitude images that were acquired by the Italian Space Agency's Cosmo-SkyMed satellite system. The images illustrate changes to the caldera area of Kīlauea Volcano that occurred between May 5 and June 2 at 6:00 p.m. HST.
Kīlauea Volcano — Halema‘uma‘u Crater Slumping Animation
Kīlauea Volcano — Halema‘uma‘u Crater Slumping AnimationThis animated GIF shows a sequence of radar amplitude images that were acquired by the Italian Space Agency's Cosmo-SkyMed satellite system. The images illustrate changes to the caldera area of Kīlauea Volcano that occurred between May 5 and June 2 at 6:00 p.m. HST.

Kīlauea Volcano — Summit Plume

West view of Fire Island, New York from the Fire Island Lighthouse
West view of Fire Island, New York from the Fire Island LighthouseThe Coastal Sediment Availability and Flux project conducts research and monitoring of sediment movement and coastal change at several barrier islands around the U.S.
West view of Fire Island, New York from the Fire Island Lighthouse
West view of Fire Island, New York from the Fire Island LighthouseThe Coastal Sediment Availability and Flux project conducts research and monitoring of sediment movement and coastal change at several barrier islands around the U.S.

Child "Candling" a Chicken Egg
A child peers at an unfertilized chicken egg at the USGS outreach booth, 2018 Suisun Marsh Field Day. USGS waterfowl ecologists use this method to check the development of a fetal duckling in the field.
*Note: photo taken with permission of parent.
A child peers at an unfertilized chicken egg at the USGS outreach booth, 2018 Suisun Marsh Field Day. USGS waterfowl ecologists use this method to check the development of a fetal duckling in the field.
*Note: photo taken with permission of parent.

ID Bands for Suisun Waterfowl
USGS scientists attach small metal bands, each with its own ID, to the ankles of adult waterfowl to identify where the animal was caught. When it is re-captured later in its migration, researchers can use that information to determine how far the animal traveled.
USGS scientists attach small metal bands, each with its own ID, to the ankles of adult waterfowl to identify where the animal was caught. When it is re-captured later in its migration, researchers can use that information to determine how far the animal traveled.

Kīlauea LERZ lava flows and fissures, June 2, 1:30 p.m.
Kīlauea LERZ lava flows and fissures, June 2, 1:30 p.m.Map as of 1:30 p.m. HST, June 2, 2018. Given the dynamic nature of Kīlauea's lower East Rift Zone eruption, with changing vent locations, fissures starting and stopping, and varying rates of lava effusion, map details shown here are accurate as of the date/time noted. Shaded purple areas indicate lava flows erupted in 1840, 1955, 1960, and 2014-2015.

Kīlauea Volcano — `A`ā Flow
East side of the fissure 8 flow on the "lighthouse road" (east of the Four Corners intersection). The ‘a‘ā flow was about 5 m (16 ft) thick when this photo was taken around 2:00 p.m. HST.
East side of the fissure 8 flow on the "lighthouse road" (east of the Four Corners intersection). The ‘a‘ā flow was about 5 m (16 ft) thick when this photo was taken around 2:00 p.m. HST.

Kīlauea Volcano — Documenting Flows
An HVO geologist documents the fissure 8 flow southeast of Four Corners (the intersection of Highways 132 and 137).
An HVO geologist documents the fissure 8 flow southeast of Four Corners (the intersection of Highways 132 and 137).

Kīlauea Volcano — Lava Flowing into Green Lake

Kīlauea Volcano — Lava Near Four Corners
Northern edge of the fissure 8 flow front on the night of June 1, as it approached the intersection of Highways 132 and 137, known as "Four Corners."
Northern edge of the fissure 8 flow front on the night of June 1, as it approached the intersection of Highways 132 and 137, known as "Four Corners."

Kīlauea Volcano — Night Fountains (Fissure 8)
Overnight (June 1-2), fissure 8 lava fountains decreased to heights of about 50 m (164 feet). The moon can be seen in the upper left.
Overnight (June 1-2), fissure 8 lava fountains decreased to heights of about 50 m (164 feet). The moon can be seen in the upper left.

Kīlauea Volcano — Overflight of Fissure 8 Advancement
Kīlauea Volcano — Overflight of Fissure 8 AdvancementUSGS scientists on HVO's overflight this morning (June 2) captured this image of the fissure 8 flow front as it advanced west along Highway 132. Around the time of this photo, 7:15 a.m.
Kīlauea Volcano — Overflight of Fissure 8 Advancement
Kīlauea Volcano — Overflight of Fissure 8 AdvancementUSGS scientists on HVO's overflight this morning (June 2) captured this image of the fissure 8 flow front as it advanced west along Highway 132. Around the time of this photo, 7:15 a.m.

USGS vessels and staff collecting geophysical data in the nearshore
USGS vessels and staff collecting geophysical data in the nearshoreUSGS vessels and staff acquiring geophysical data in the nearshore. Collecting shoreface data in the water as close to the beach as possible is difficult with breaking waves. The USGS St. Petersburg Coastal and Marine Science Center adapted existing equipment for data collection in shallow water.

Vehicles Using An Elevated Road Segment Over Wildlife Passage
Vehicles Using An Elevated Road Segment Over Wildlife PassageVehicles drive on an elevated road segment that allows amphibians and reptiles to pass safely beneath and cross the road.
Vehicles Using An Elevated Road Segment Over Wildlife Passage
Vehicles Using An Elevated Road Segment Over Wildlife PassageVehicles drive on an elevated road segment that allows amphibians and reptiles to pass safely beneath and cross the road.

A false-color aerial photo
A false-color aerial photo illuminates the stark contrast between irrigated center pivot cropland and dryland agriculture in eastern Washington
A false-color aerial photo illuminates the stark contrast between irrigated center pivot cropland and dryland agriculture in eastern Washington

Blue Vane trap in Conservation Reserve Program (CRP) field
Blue Vane trap in Conservation Reserve Program (CRP) fieldBlue Vane trap in Conservation Reserve Program (CRP) field
Blue Vane trap in Conservation Reserve Program (CRP) field
Blue Vane trap in Conservation Reserve Program (CRP) fieldBlue Vane trap in Conservation Reserve Program (CRP) field

Container of mud from the Clarion-Clipperton Zone
Container of mud from the Clarion-Clipperton Zone, an expanse of the deep Pacific seafloor rich in manganese nodules. Amy Gartman (USGS) and Phoebe Lam (University of California, Santa Cruz) will study chemical interactions between the mud and metals in seawater.
Container of mud from the Clarion-Clipperton Zone, an expanse of the deep Pacific seafloor rich in manganese nodules. Amy Gartman (USGS) and Phoebe Lam (University of California, Santa Cruz) will study chemical interactions between the mud and metals in seawater.

Field Photo Friday January 2019
A team of biologists, Barry Baldigo, Luis Rodriguez, Mike DeMoulpied, and Abbey Holsopple (from left to right), prepare to conduct a survey for invasive round goby on the New York State Canal system near Rome, NY in 2018. Photo by Scott George
A team of biologists, Barry Baldigo, Luis Rodriguez, Mike DeMoulpied, and Abbey Holsopple (from left to right), prepare to conduct a survey for invasive round goby on the New York State Canal system near Rome, NY in 2018. Photo by Scott George