
Cows feed on a farm in southern Wisconsin. A new USGS report shows that drought periods followed by rainfall caused nitrate levels to increase to the highest ever measured in some Midwest streams during a 2013 study.
Images
Explore our planet through photography and imagery, including climate change and water all the way back to the 1800s when the USGS was surveying the country by horse and buggy.
Filter Total Items: 21545

Farm in southern Wisconsin
Cows feed on a farm in southern Wisconsin. A new USGS report shows that drought periods followed by rainfall caused nitrate levels to increase to the highest ever measured in some Midwest streams during a 2013 study.

Farm in southern Wisconsin
An irrigation system waters crops in southern Wisconsin. A new USGS report shows that drought periods followed by rainfall caused nitrate levels to increase to the highest ever measured in some Midwest streams during a 2013 study.
An irrigation system waters crops in southern Wisconsin. A new USGS report shows that drought periods followed by rainfall caused nitrate levels to increase to the highest ever measured in some Midwest streams during a 2013 study.

Small stream in northern Indiana
A small stream flows through corn fields in northern Indiana. A new USGS report shows that drought periods followed by rainfall caused nitrate levels to increase to the highest ever measured in some Midwest streams during a 2013 study.
A small stream flows through corn fields in northern Indiana. A new USGS report shows that drought periods followed by rainfall caused nitrate levels to increase to the highest ever measured in some Midwest streams during a 2013 study.

USGS scientist getting ready to measure discharge (flow)
In this photo the USGS scientist is getting ready to measure discharge (flow) in the same stream as above (from New York Branch, Iowa), but after a rainfall event.
In this photo the USGS scientist is getting ready to measure discharge (flow) in the same stream as above (from New York Branch, Iowa), but after a rainfall event.

2016 Fairweather Fault research crew commute
The field crew trekked miles daily to reach their research sites.
The field crew trekked miles daily to reach their research sites.
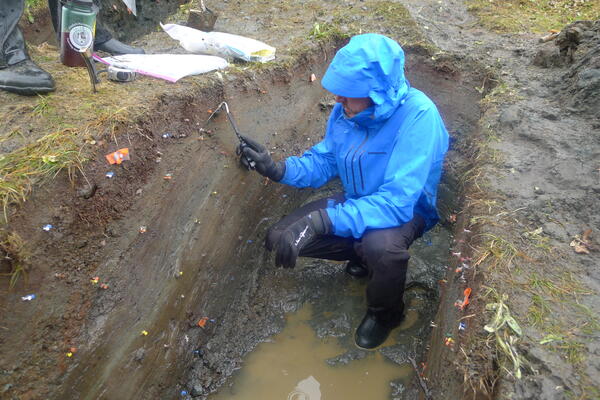
2016 Fairweather Fault trenching
The team’s work included excavating trenches across the fault to examine layers of sediment.
The team’s work included excavating trenches across the fault to examine layers of sediment.

Alaska field crew next to a trench
The field crew studies various areas thoughout the fault.
The field crew studies various areas thoughout the fault.

Alaska field team
The field team included USGS geologists Rob Witter, Adrian Bender, Chris DuRoss, Peter Haeussler, Richard Lease and Kate Scharer
The field team included USGS geologists Rob Witter, Adrian Bender, Chris DuRoss, Peter Haeussler, Richard Lease and Kate Scharer

Alaska field team revisit Tocher's 1958 site
The field team revisited many of the same locations geologists Don Tocher and Don Miller studied in 1958.
The field team revisited many of the same locations geologists Don Tocher and Don Miller studied in 1958.

Alaska field team walking to sample site
The field crew walked miles daily to research the Fairweather fault and surrounding areas.
The field crew walked miles daily to research the Fairweather fault and surrounding areas.

Fairweather Fault
USGS research geologist Kate Scharer with her finger on the Fairweather Fault in southeast Alaska. The magnitude 7.8 Lituya Bay earthquake caused shaking that toppled trees along the fault, which left a break in the forest shown here.
USGS research geologist Kate Scharer with her finger on the Fairweather Fault in southeast Alaska. The magnitude 7.8 Lituya Bay earthquake caused shaking that toppled trees along the fault, which left a break in the forest shown here.

Fairweather fault lidar
Fairweather fault lidar

Glacier Bay National Park
Trench site along the southern Fairweather Fault, in Glacier Bay National Park, Alaska. The alluvial fan at left consists of lake, stream channel and debris flow deposits impounded by the Fairweather Fault scarp, at right.
Trench site along the southern Fairweather Fault, in Glacier Bay National Park, Alaska. The alluvial fan at left consists of lake, stream channel and debris flow deposits impounded by the Fairweather Fault scarp, at right.

Glacier Bay National Park
View of Glacier Bay National Park from the air.
View of Glacier Bay National Park from the air.
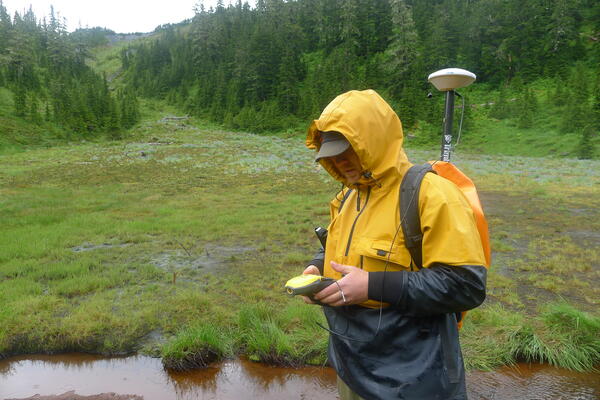
New technology furthers Fairweather fault research
Scientists use current technology to further Fairweather Fault research.
Scientists use current technology to further Fairweather Fault research.

South Crillon Glacier
Periodic calving of ice from the snout of South Crillon Glacier.
Periodic calving of ice from the snout of South Crillon Glacier.

South Crillon Glacier
Nearly 60 years after a magnitude 7.7 earthquake struck Lituya Bay, Alaska — leading to a tsunami that devastated the area — six U.S. Geological Survey geologists revisited the isolated region of Alaska, to pick up where their scientific predecessors left off.
Nearly 60 years after a magnitude 7.7 earthquake struck Lituya Bay, Alaska — leading to a tsunami that devastated the area — six U.S. Geological Survey geologists revisited the isolated region of Alaska, to pick up where their scientific predecessors left off.

Total Water Level and Coastal Change Forecast Viewer
Screenshot of Total Water Level and Coastal Change Forecast Viewer on June 4, 2016, two days before Tropical Storm Colin was expected to hit Florida’s Gulf of Mexico coast.
Screenshot of Total Water Level and Coastal Change Forecast Viewer on June 4, 2016, two days before Tropical Storm Colin was expected to hit Florida’s Gulf of Mexico coast.

Research Drilling Rig and Landscape
The USGS Core Research Center collaborated with the USGS Energy Resources Program to drill a core from the Mancos Shale to aid in the oil and gas assessment. Image Credit: Joshua Hicks, USGS.
The USGS Core Research Center collaborated with the USGS Energy Resources Program to drill a core from the Mancos Shale to aid in the oil and gas assessment. Image Credit: Joshua Hicks, USGS.

Sarah Hawkins Receives the Core
USGS scientist Sarah Hawkins, lead scientist for the Mancos Shale assessment, examining a core drilled by the USGS Core Research Center. This core provided valuable data for the assessment. Image credit: Joshua Hicks, USGS.
USGS scientist Sarah Hawkins, lead scientist for the Mancos Shale assessment, examining a core drilled by the USGS Core Research Center. This core provided valuable data for the assessment. Image credit: Joshua Hicks, USGS.

A gull marked with a satellite transmitter at the Soldotna landfill
John Reed (USGS scientist) holding a gull marked with a satellite transmitter at the Soldotna landfill in June 2016.
John Reed (USGS scientist) holding a gull marked with a satellite transmitter at the Soldotna landfill in June 2016.