Elizabeth Pendleton describes USGS work to map the Mass. seafloor
Elizabeth Pendleton describes USGS work to map the Mass. seafloorElizabeth Pendleton describes USGS work to map the Massachusetts seafloor to State Senator Viriato “Vinny” deMacedo.

Official websites use .gov
A .gov website belongs to an official government organization in the United States.
Secure .gov websites use HTTPS
A lock () or https:// means you’ve safely connected to the .gov website. Share sensitive information only on official, secure websites.
Coastal and Marine Hazards and Resources Program images.

Elizabeth Pendleton describes USGS work to map the Massachusetts seafloor to State Senator Viriato “Vinny” deMacedo.
Elizabeth Pendleton describes USGS work to map the Massachusetts seafloor to State Senator Viriato “Vinny” deMacedo.

Orthomosaic images of Matanzas, Florida, from (a) before and (b) after Hurricane Matthew, and (c) a digital elevation model (DEM) showing the associated topographic change. Note, these results were produced by applying Structure-from-Motion (SfM) to NOAA oblique photographs, but similar results can be obtained using UAS aerial imagery.
Orthomosaic images of Matanzas, Florida, from (a) before and (b) after Hurricane Matthew, and (c) a digital elevation model (DEM) showing the associated topographic change. Note, these results were produced by applying Structure-from-Motion (SfM) to NOAA oblique photographs, but similar results can be obtained using UAS aerial imagery.

Exposed bedrock on the beach during very low (negative) tide at Isla Vista, California
Exposed bedrock on the beach during very low (negative) tide at Isla Vista, California
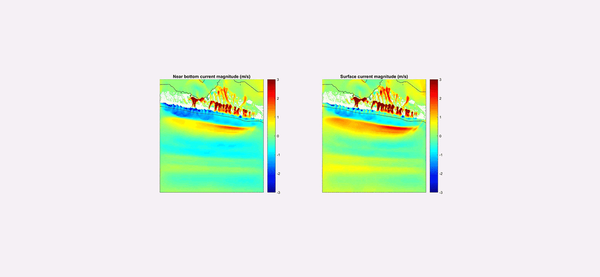
USGS scientists built a model that reproduces the waves, currents (shown in meters per second [m/s]), and sand movement at Fire Island during Hurricane Sandy’s passage (Warner and others, 2017).
USGS scientists built a model that reproduces the waves, currents (shown in meters per second [m/s]), and sand movement at Fire Island during Hurricane Sandy’s passage (Warner and others, 2017).

Perspective views of multibeam bathymetry data acquired by the USGS aboard the R/V Medeia. Shallower depths in red. Arrows point to the distinct line in the seafloor associated with the Queen Charlotte-Fairweather fault.
Perspective views of multibeam bathymetry data acquired by the USGS aboard the R/V Medeia. Shallower depths in red. Arrows point to the distinct line in the seafloor associated with the Queen Charlotte-Fairweather fault.

A look into the USGS Pacific Coastal and Marine Science Center’s Marine Minerals Laboratory Suite.
A look into the USGS Pacific Coastal and Marine Science Center’s Marine Minerals Laboratory Suite.

Woods Hole Coastal and Marine Science Center Oceanographer, Neil Ganju, sharing science at the 2017 Woods Hole Science Stroll outreach event
Woods Hole Coastal and Marine Science Center Oceanographer, Neil Ganju, sharing science at the 2017 Woods Hole Science Stroll outreach event

Gerry Hatcher (left) and Shawn Harrison work on their video-camera station atop a hotel in Santa Cruz, California.
Gerry Hatcher (left) and Shawn Harrison work on their video-camera station atop a hotel in Santa Cruz, California.

Map of Edwin B Forsythe National Wildlife Refuge, N.J., marsh shoreline change rates.
Map of Edwin B Forsythe National Wildlife Refuge, N.J., marsh shoreline change rates.

Basemap of the United States with an overview image of elevation models
Basemap of the United States with an overview image of elevation models

Authigenic carbonate supplies the foundation for deep-sea corals, including colonies of bubblegum corals (Paragorgia) seen here.
Authigenic carbonate supplies the foundation for deep-sea corals, including colonies of bubblegum corals (Paragorgia) seen here.

(A) Maximum Likelihood Classification (MLC) with two inputs, slope, and ISO-classified backscatter for the whole survey area. (B) MLC with five inputs, slope, ISO-classified backscatter, bathymetry, hillshaded-relief, and curvature.
(A) Maximum Likelihood Classification (MLC) with two inputs, slope, and ISO-classified backscatter for the whole survey area. (B) MLC with five inputs, slope, ISO-classified backscatter, bathymetry, hillshaded-relief, and curvature.

Time series of the coral reef at Grecian Rocks (Key Largo, FL) illustrating an example of the dramatic decline in live coral on Florida Keys reefs in recent decades. From Shinn and Kuffner (2017).
Time series of the coral reef at Grecian Rocks (Key Largo, FL) illustrating an example of the dramatic decline in live coral on Florida Keys reefs in recent decades. From Shinn and Kuffner (2017).

Views of Cowells Beach in Santa Cruz, California, from a 10-minute video shot on May 6, 2017. Snapshot (first frame in video) on left; time-averaged image on right.
Views of Cowells Beach in Santa Cruz, California, from a 10-minute video shot on May 6, 2017. Snapshot (first frame in video) on left; time-averaged image on right.

Gerry Hatcher with the system he designed to record the precise time and geographic location of each air photo Van Wagenen shoots.
Gerry Hatcher with the system he designed to record the precise time and geographic location of each air photo Van Wagenen shoots.

Paul’s Slide. Left: Air photo taken May 27, 2017, one of many that Beth Haddon will analyze with structure-from-motion software to measure changes in ground elevation. Right: Caltrans employees and contractors use an excavator and bulldozer to remove Paul’s Slide debris from California State Highway 1.
Paul’s Slide. Left: Air photo taken May 27, 2017, one of many that Beth Haddon will analyze with structure-from-motion software to measure changes in ground elevation. Right: Caltrans employees and contractors use an excavator and bulldozer to remove Paul’s Slide debris from California State Highway 1.
USGS research oceanographer Neil Ganju shares a time-lapse video showing salt marsh erosion.
USGS research oceanographer Neil Ganju shares a time-lapse video showing salt marsh erosion.

Tracklines along which R/V Ocean Starr (2017, red lines) and R/V Norseman (2016, black lines) conducted seismic-reflection surveys, overlaid on high-resolution bathymetry (color background). Yellow stars represent earthquakes of magnitude (M) 7 and greater since 1900.
Tracklines along which R/V Ocean Starr (2017, red lines) and R/V Norseman (2016, black lines) conducted seismic-reflection surveys, overlaid on high-resolution bathymetry (color background). Yellow stars represent earthquakes of magnitude (M) 7 and greater since 1900.

The 3DR Solo with GoPro Hero4 camera and gimbal. Coming to a beach near you soon.
The 3DR Solo with GoPro Hero4 camera and gimbal. Coming to a beach near you soon.

Map of subsea permafrost distributions on the U.S. and Canadian Arctic Ocean margin. The inset map shows the location of the larger map. Subsea permafrost on the Canadian margin was delineated in the 1980s (blue curve). The red curve on the U.S.
Map of subsea permafrost distributions on the U.S. and Canadian Arctic Ocean margin. The inset map shows the location of the larger map. Subsea permafrost on the Canadian margin was delineated in the 1980s (blue curve). The red curve on the U.S.

Eroding permafrost on Alaska’s Arctic Coast. Inundation of permafrost like this produced subsea permafrost
Eroding permafrost on Alaska’s Arctic Coast. Inundation of permafrost like this produced subsea permafrost