USGS collects data in the back-barrier at Fire Island
USGS collects data in the back-barrier at Fire IslandThe USGS uses observations and data collection in the back-barrier environment at Fire Island, NY to inform numerical models.


Official websites use .gov
A .gov website belongs to an official government organization in the United States.

Secure .gov websites use HTTPS
A lock () or https:// means you’ve safely connected to the .gov website. Share sensitive information only on official, secure websites.

Coastal and Marine Hazards and Resources Program images.

The USGS uses observations and data collection in the back-barrier environment at Fire Island, NY to inform numerical models.
The USGS uses observations and data collection in the back-barrier environment at Fire Island, NY to inform numerical models.

USGS monitors the growth rates of the threatened Elkhorn Coral (Acropora palmata) at Dry Tortugas National Park (pictured) and throughout the Florida Keys, U.S.A.
USGS monitors the growth rates of the threatened Elkhorn Coral (Acropora palmata) at Dry Tortugas National Park (pictured) and throughout the Florida Keys, U.S.A.
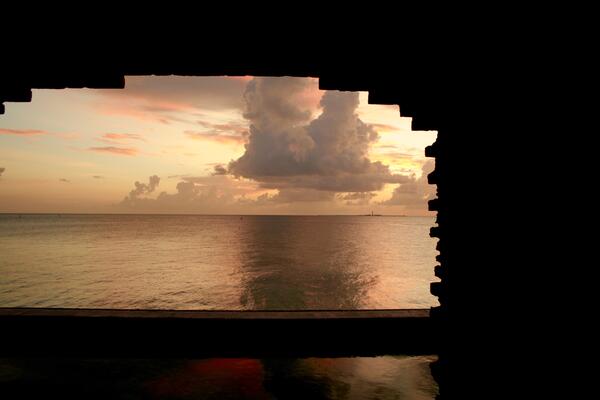
Looking at the sunset on the Gulf of America through a window of Fort Jefferson on Dry Torgugas National Park.
Looking at the sunset on the Gulf of America through a window of Fort Jefferson on Dry Torgugas National Park.

USGS Research Scientist, Meagan Gonneea, talking about the differences between coastal salt marshes and invasive phragmites at the 2017 Woods Hole Science Stroll outreach event
USGS Research Scientist, Meagan Gonneea, talking about the differences between coastal salt marshes and invasive phragmites at the 2017 Woods Hole Science Stroll outreach event

Woods Hole Coastal and Marine Science Center Scientific Programmer, Tarandeep Kalra, talking to children about oceanographic modeling at the 2017 Woods Hole Science Stroll
Woods Hole Coastal and Marine Science Center Scientific Programmer, Tarandeep Kalra, talking to children about oceanographic modeling at the 2017 Woods Hole Science Stroll

Aeiral image of Woods Hole, MA taken during the 2017 Woods Hole Science Stroll. The green USGS tent generated a lot of interest and participation from Science Stroll attendees
Aeiral image of Woods Hole, MA taken during the 2017 Woods Hole Science Stroll. The green USGS tent generated a lot of interest and participation from Science Stroll attendees

Woods Hole Coastal and Marine Science Center drone pilot, Emily Sturdivant, provides a demonstration of drone capabilities at the 2017 Woods Hole Science Stroll
Woods Hole Coastal and Marine Science Center drone pilot, Emily Sturdivant, provides a demonstration of drone capabilities at the 2017 Woods Hole Science Stroll

Woods Hole Coastal and Marine Science Center drone pilot, Emily Sturdivant, lands a drone on target at the 2017 Woods Hole Science Stroll
Woods Hole Coastal and Marine Science Center drone pilot, Emily Sturdivant, lands a drone on target at the 2017 Woods Hole Science Stroll

SeaBOSS Selfies were a big hit at the 2017 Woods Hole Science Stroll.
SeaBOSS Selfies were a big hit at the 2017 Woods Hole Science Stroll.

Woods Hole Coastal and Marine Science Center Science Stroll participants; Dann Blackwood, Andrea Toran, Emily Sturdivant, Ellyn Montgomery, Sara Zeigler, Neil Ganju, Seth Ackerman, Laura Brothers, Meagan Gonneea
Woods Hole Coastal and Marine Science Center Science Stroll participants; Dann Blackwood, Andrea Toran, Emily Sturdivant, Ellyn Montgomery, Sara Zeigler, Neil Ganju, Seth Ackerman, Laura Brothers, Meagan Gonneea

Josh Logan operates a drone carrying a precision GPS and special camera to map the shore at Long Beach, Washington. USGS scientists used the same system for detailed mapping of beaches beside Monterey Bay, California.
Josh Logan operates a drone carrying a precision GPS and special camera to map the shore at Long Beach, Washington. USGS scientists used the same system for detailed mapping of beaches beside Monterey Bay, California.

Flow from San Gregorio Creek in San Gregorio, California is often blocked by a natural sand levee when the flow is not strong enough to push through to the Pacific Ocean.
Flow from San Gregorio Creek in San Gregorio, California is often blocked by a natural sand levee when the flow is not strong enough to push through to the Pacific Ocean.

Instrument package mounted to the seaward slope of a coral reef off southwestern Puerto Rico.
Instrument package mounted to the seaward slope of a coral reef off southwestern Puerto Rico.

Left to right: In July 2017 Tim Elfers (USGS), Hannah Drummond (WA State Dept. of Ecology), Heather Weiner (WA State Dept. of Ecology), Andrew Stevens (USGS), and Andy Ritchie (USGS) used handheld computers and backpack-mounted GPS equipment to record topography along a beach near the mouth of the Elwha River.
Left to right: In July 2017 Tim Elfers (USGS), Hannah Drummond (WA State Dept. of Ecology), Heather Weiner (WA State Dept. of Ecology), Andrew Stevens (USGS), and Andy Ritchie (USGS) used handheld computers and backpack-mounted GPS equipment to record topography along a beach near the mouth of the Elwha River.

Joseph Terrano of the USGS St. Petersburg Coastal and Marine Science Center retrieves a sediment sample from under the marsh grass. Scientists installed several Net Sediment Tiles (NST) on the surface of the marsh to measure sediment deposition.
Joseph Terrano of the USGS St. Petersburg Coastal and Marine Science Center retrieves a sediment sample from under the marsh grass. Scientists installed several Net Sediment Tiles (NST) on the surface of the marsh to measure sediment deposition.

Lead-in to the Mud Creek slide UAS (drone) footage, Big Sur, California, July 19. 2017.
Lead-in to the Mud Creek slide UAS (drone) footage, Big Sur, California, July 19. 2017.

The small computer, or “micro-controller,” at the bottom of this photo controls the operation of two video cameras mounted on the 10-story Dream Inn hotel in Santa Cruz, California.
The small computer, or “micro-controller,” at the bottom of this photo controls the operation of two video cameras mounted on the 10-story Dream Inn hotel in Santa Cruz, California.

Sediment consolidation in an oedometer provides constraints on how much the reservoir sediment is likely to compact while methane from the reservoir’s gas hydrate is extracted as an energy resource. Compaction data helps engineers optimize the construction and operation of wells that target gas hydrate reservoirs.
Sediment consolidation in an oedometer provides constraints on how much the reservoir sediment is likely to compact while methane from the reservoir’s gas hydrate is extracted as an energy resource. Compaction data helps engineers optimize the construction and operation of wells that target gas hydrate reservoirs.

Near San Simeon, view looks north up Highway 1 along the California coast toward Big Sur.
Near San Simeon, view looks north up Highway 1 along the California coast toward Big Sur.

Drone’s-eye views of the toe of the Mud Creek landslide, from videos shot by Shawn Harrison on July 12, 2017
Drone’s-eye views of the toe of the Mud Creek landslide, from videos shot by Shawn Harrison on July 12, 2017

Preliminary seafloor bathymetry (shown in colors) collected by the USGS research vessel Parke Snavely on July 11, 2017. Relative depths shown in color, superimposed on a shaded-relief map from the June 26 USGS air-photo survey. Note white data gap next to the shore where water was too shallow for the Snavely to map.
Preliminary seafloor bathymetry (shown in colors) collected by the USGS research vessel Parke Snavely on July 11, 2017. Relative depths shown in color, superimposed on a shaded-relief map from the June 26 USGS air-photo survey. Note white data gap next to the shore where water was too shallow for the Snavely to map.