
USGS Research Oceanographer Lauren Toth and Oceanographer Anastasios Stathakopoulos study a coral-reef core in the USGS’s Core Archive in St. Petersburg, Florida. Photo: Dominique Gallery, USGS.
Images
Images from the Southeast Region.
Filter Total Items: 394

Coral cores like this one reveal geologic history of Keys reefs
USGS Research Oceanographer Lauren Toth and Oceanographer Anastasios Stathakopoulos study a coral-reef core in the USGS’s Core Archive in St. Petersburg, Florida. Photo: Dominique Gallery, USGS.


Hurricane Michael cut deep into Panhandle dunes
A deeply eroded sand dune on the beach at Cape San Blas shows Hurricane Michael's impact on parts of the Florida Panhandle shoreline.
A deeply eroded sand dune on the beach at Cape San Blas shows Hurricane Michael's impact on parts of the Florida Panhandle shoreline.

Hurricane Michael destroyed many houses on Cape San Blas, Florida
A beach house in Cape San Blas, Florida destroyed by Hurricane Michael, which struck the Florida Panhandle as a Category Four storm Oct. 10, 2018.
A beach house in Cape San Blas, Florida destroyed by Hurricane Michael, which struck the Florida Panhandle as a Category Four storm Oct. 10, 2018.

New Gulf of Mexico network speeds USGS hurricane preparations
Each one these blue dots represents a site where a storm-tide sensor bracket has been installed for the Gulf of Mexico pre-defined network. There are currently 85 brackets in Florida, 6 in Alabama, 3 in Mississippi, 18 in Louisiana and 26 in Texas, for a total of 138 bracketed sites. (Not all brackets will be used in all storms.)
Each one these blue dots represents a site where a storm-tide sensor bracket has been installed for the Gulf of Mexico pre-defined network. There are currently 85 brackets in Florida, 6 in Alabama, 3 in Mississippi, 18 in Louisiana and 26 in Texas, for a total of 138 bracketed sites. (Not all brackets will be used in all storms.)

This Flood Event Viewer is a one-stop information source
The USGS creates a Flood Event Viewer for major flooding incidents, as a one-stop, interactive information source. On that website, viewers can click on each red dot (storm-tide sensor) to see details about it.
The USGS creates a Flood Event Viewer for major flooding incidents, as a one-stop, interactive information source. On that website, viewers can click on each red dot (storm-tide sensor) to see details about it.

Strong hurricane impacts predicted for many Panhandle beaches
Coastal Change Storm Hazard Team map created Tuesday, 10/89/18 showing current forecasted beach erosion, overwash and inundation effects of Hurricane Michael's predicted landfall in the Florida Panhandle. Forecast will change with subsequent National Hurricane Center forecasts.
Coastal Change Storm Hazard Team map created Tuesday, 10/89/18 showing current forecasted beach erosion, overwash and inundation effects of Hurricane Michael's predicted landfall in the Florida Panhandle. Forecast will change with subsequent National Hurricane Center forecasts.

Fish Inn, the scientists' field station, before Hurricane Michael
For ten years, this yellow concrete block house in Cape San Blas, Florida, dubbed Fish Inn, was the seasonal office, laboratory and living quarters for a team of USGS sea turtle researchers during their field season from November till April.
For ten years, this yellow concrete block house in Cape San Blas, Florida, dubbed Fish Inn, was the seasonal office, laboratory and living quarters for a team of USGS sea turtle researchers during their field season from November till April.

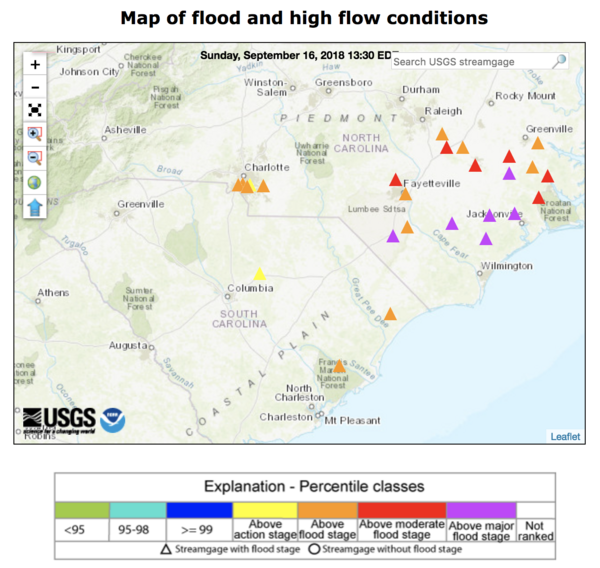
USGS science on a map of the Carolinas after Hurricane Florence
This flood event viewer map, dated Oct. 3, 2018, shows the extent and type of information collected by USGS hydrologists in North and South Carolina in the wake of historic flooding brought on by Hurricane Florence.
This flood event viewer map, dated Oct. 3, 2018, shows the extent and type of information collected by USGS hydrologists in North and South Carolina in the wake of historic flooding brought on by Hurricane Florence.

Double-checking a high water mark on a church door near Maxton, NC
USGS hydrographer Daniel McCay uses a level to double-check a high water mark on a church door near Maxton, NC as his USGS colleague Mary Winsor observes on Sept. 25, 2018, in the wake of flooding brought on by Hurricane Florence.
USGS hydrographer Daniel McCay uses a level to double-check a high water mark on a church door near Maxton, NC as his USGS colleague Mary Winsor observes on Sept. 25, 2018, in the wake of flooding brought on by Hurricane Florence.

A high water mark above the eaves of a Spring Hill, NC house
USGS hydrologic technician Rob Forde flags a high water mark above the eaves at Presbyterian Church of the Covenant, 118 Manchester Road, Spring Hill, North Carolina on Sept. 21, 2018, in the wake of flooding brought on by Hurricane Florence.
USGS hydrologic technician Rob Forde flags a high water mark above the eaves at Presbyterian Church of the Covenant, 118 Manchester Road, Spring Hill, North Carolina on Sept. 21, 2018, in the wake of flooding brought on by Hurricane Florence.

Measuring a high water mark as flooding recedes
USGS hydrographer Kyle Marchman measures a high water mark on the rear wall of a Kangaroo gas station on Highway 24 north of Fayetteville, NC on Sept. 18, 2018, after flooding caused by Hurricane Florence.
USGS hydrographer Kyle Marchman measures a high water mark on the rear wall of a Kangaroo gas station on Highway 24 north of Fayetteville, NC on Sept. 18, 2018, after flooding caused by Hurricane Florence.

Measuring the Lumber River floodwaters
James Stonecypher measures flood waters from the Lumber River that breached a dam in Lumberton, North Carolina after the passage of Hurricane Florence, Sept. 17, 2018.
James Stonecypher measures flood waters from the Lumber River that breached a dam in Lumberton, North Carolina after the passage of Hurricane Florence, Sept. 17, 2018.
As Florence rains, rivers keep rising, submerging some USGS instrument
A WaterWatch web map shows streamgages in North and South Carolina that approached or exceeded major flood stage EST on September 19, 2018, as the former Hurricane Florence, now downgraded to a tropical depression, deluged the states with rain.
A WaterWatch web map shows streamgages in North and South Carolina that approached or exceeded major flood stage EST on September 19, 2018, as the former Hurricane Florence, now downgraded to a tropical depression, deluged the states with rain.

Working to keep vital flood information flowing in the Carolinas
David Stillwell, USGS hydrologic technician, performs a discharge measurement to help document and forecast flooding caused by Hurricane Florence at Long Creek in Rhyne, North Carolina on Sept. 16.
David Stillwell, USGS hydrologic technician, performs a discharge measurement to help document and forecast flooding caused by Hurricane Florence at Long Creek in Rhyne, North Carolina on Sept. 16.

USGS Storm-Tide Sensor for Hurricane Florence
A USGS storm-tide sensor, deployed in advance of Hurricane Florence's landfall. The sensors are housed in vented steel pipes a few inches wide and about a foot long. They are being installed on bridges, piers, and other structures that have a good chance of surviving the storm.
A USGS storm-tide sensor, deployed in advance of Hurricane Florence's landfall. The sensors are housed in vented steel pipes a few inches wide and about a foot long. They are being installed on bridges, piers, and other structures that have a good chance of surviving the storm.

Retrieving Seismic Airguns
USGS personnel on the deck of the R/V Hugh R.
USGS personnel on the deck of the R/V Hugh R.

Erosion has taken a toll on this Keys coral
A reef in the Florida Keys National Marine Sanctuary with little living coral and extensive bioerosion. Photo taken under research permit number FKNMS-2016-085-A1. Credit: USGS, Ilsa Kuffner.
A reef in the Florida Keys National Marine Sanctuary with little living coral and extensive bioerosion. Photo taken under research permit number FKNMS-2016-085-A1. Credit: USGS, Ilsa Kuffner.
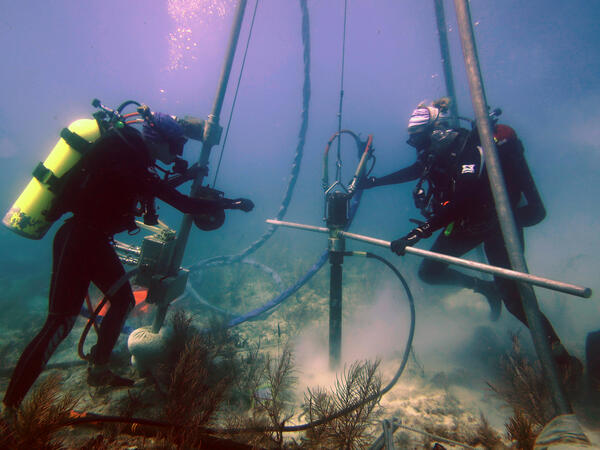
USGS scientists drill a coral-reef core in the Florida Keys
Research Oceanographer Lauren Toth and student volunteer Liz Whitcher drill a coral-reef core from a reef off Key West, Florida, in the Florida Keys National Marine Sanctuary. Photo taken under research permit FKNMS-2015-058. Credit: Anastasios Stathakopoulos, USGS.
Research Oceanographer Lauren Toth and student volunteer Liz Whitcher drill a coral-reef core from a reef off Key West, Florida, in the Florida Keys National Marine Sanctuary. Photo taken under research permit FKNMS-2015-058. Credit: Anastasios Stathakopoulos, USGS.

Like many Keys corals, this one has no new growth
A modern coral reef in Dry Tortugas National Park. There is little living coral and high rates of bioerosion. Photo taken under research permit number DRTO-2018-SCI-0005. Credit: Lauren Toth, USGS
A modern coral reef in Dry Tortugas National Park. There is little living coral and high rates of bioerosion. Photo taken under research permit number DRTO-2018-SCI-0005. Credit: Lauren Toth, USGS

1985-2018 Lionfish Invasion
Lionfish invasion (1985-2018). Lionfish invaded US Atlantic coastal waters, the Caribbean Sea, and the Gulf of Mexico with unprecedented, alarming speed. Though reports of sightings date back to the 1980s, it is only recently that the species has exploded in numbers and range.
Lionfish invasion (1985-2018). Lionfish invaded US Atlantic coastal waters, the Caribbean Sea, and the Gulf of Mexico with unprecedented, alarming speed. Though reports of sightings date back to the 1980s, it is only recently that the species has exploded in numbers and range.