Crinoid fossil from northern Yellowstone National Park
Crinoid fossil from northern Yellowstone National ParkCrinoid fossil from a Paleozoic rock unit found in northern Yellowstone National Park.

Official websites use .gov
A .gov website belongs to an official government organization in the United States.
Secure .gov websites use HTTPS
A lock () or https:// means you’ve safely connected to the .gov website. Share sensitive information only on official, secure websites.

Crinoid fossil from a Paleozoic rock unit found in northern Yellowstone National Park.
Crinoid fossil from a Paleozoic rock unit found in northern Yellowstone National Park.

Steam vents along the Yellowstone River near Mud Volcano thermal area, Yellowstone National Park.
Steam vents along the Yellowstone River near Mud Volcano thermal area, Yellowstone National Park.

Mudpot located in the Mud Volcano thermal area of Yellowstone National Park. This type of thermal feature indicates an acid-sulfate system.
Mudpot located in the Mud Volcano thermal area of Yellowstone National Park. This type of thermal feature indicates an acid-sulfate system.

Thermal anomaly map of Yellowstone National Park, based on a Landsat 8 nighttime thermal infrared image from 9 January 2021. The color ramp indicates the intensity of the above-background thermal anomaly for each thermal area. Lakes are blue. Yellowstone caldera and resurgent domes are outlined in black.
Thermal anomaly map of Yellowstone National Park, based on a Landsat 8 nighttime thermal infrared image from 9 January 2021. The color ramp indicates the intensity of the above-background thermal anomaly for each thermal area. Lakes are blue. Yellowstone caldera and resurgent domes are outlined in black.

Eruptions of Steamboat Geyser over time. (A) Cumulative eruptions of Steamboat Geyser since 1960. Each dot represents an eruption. (B) Comparative plot of the cumulative eruptions in each active phase (1960s, 1980s, and 2018-). Data from GeyserTimes.
Eruptions of Steamboat Geyser over time. (A) Cumulative eruptions of Steamboat Geyser since 1960. Each dot represents an eruption. (B) Comparative plot of the cumulative eruptions in each active phase (1960s, 1980s, and 2018-). Data from GeyserTimes.

Steamboat Geyser eruption signals recorded by nearby monitoring instruments. The vertical pink lines mark when the signal first appears. (A) Seismic station YNM records a signal which slowly tapers as the eruption decreases in intensity. Spikes seen before the eruption are mostly due to human activity.
Steamboat Geyser eruption signals recorded by nearby monitoring instruments. The vertical pink lines mark when the signal first appears. (A) Seismic station YNM records a signal which slowly tapers as the eruption decreases in intensity. Spikes seen before the eruption are mostly due to human activity.

Map of seismicity (red circles) in the Yellowstone region during 2020. Gray lines are roads, red line shows the caldera boundary, Yellowstone National Park is outlined by black dashed line, and gray dashed lines denote state boundaries.
Map of seismicity (red circles) in the Yellowstone region during 2020. Gray lines are roads, red line shows the caldera boundary, Yellowstone National Park is outlined by black dashed line, and gray dashed lines denote state boundaries.

Section from the piston core YL92-1C, collected in south-central Yellowstone Lake. The core is viewed horizontally, with the top of core to the left. The core section shown is from 5.21–5.63 meters (17–18.4 feet) depth.
Section from the piston core YL92-1C, collected in south-central Yellowstone Lake. The core is viewed horizontally, with the top of core to the left. The core section shown is from 5.21–5.63 meters (17–18.4 feet) depth.

Swath bathymetric image of the Elliott’s Crater explosion crater in Yellowstone Lake. Inset shows location of the crater and the swath image (red box) within the northern part of the lake.
Swath bathymetric image of the Elliott’s Crater explosion crater in Yellowstone Lake. Inset shows location of the crater and the swath image (red box) within the northern part of the lake.

The right side of the figure is an image of a small piece of the Y-9 core from the USGS 1967-68 drilling expedition to Yellowstone National Park. The black area was analyzed using a scanning electron microscope (SEM) at the University of Wyoming to determine mineralogy and dispersion of elements.
The right side of the figure is an image of a small piece of the Y-9 core from the USGS 1967-68 drilling expedition to Yellowstone National Park. The black area was analyzed using a scanning electron microscope (SEM) at the University of Wyoming to determine mineralogy and dispersion of elements.

Research drilling in Yellowstone National Park. (A) is an image from Fenner (1936) of the drilling setup in the Upper Geyser Basin during the 1929 field season. (B) is an image from White et al. (1975) of the USGS drill rig set up in the Norris Geyser Basin in 1967-68 during a steam eruption.
Research drilling in Yellowstone National Park. (A) is an image from Fenner (1936) of the drilling setup in the Upper Geyser Basin during the 1929 field season. (B) is an image from White et al. (1975) of the USGS drill rig set up in the Norris Geyser Basin in 1967-68 during a steam eruption.

Map of earthquakes that occurred beneath Yellowstone Lake as parts of seismic swarms in 2008-2009 (green) and 2020 (red). Orange line is the boundary of Yellowstone Caldera, which formed 631,000 years ago.
Map of earthquakes that occurred beneath Yellowstone Lake as parts of seismic swarms in 2008-2009 (green) and 2020 (red). Orange line is the boundary of Yellowstone Caldera, which formed 631,000 years ago.

Rate of earthquake occurrence for the 2008-2009 Yellowstone Lake swarm (green) and 2020 swarm (red).
Rate of earthquake occurrence for the 2008-2009 Yellowstone Lake swarm (green) and 2020 swarm (red).

Snake River near Moran, streamgage 13011000, during a winter visit. Streamgage located downstream of Jackson Lake Dam.
Snake River near Moran, streamgage 13011000, during a winter visit. Streamgage located downstream of Jackson Lake Dam.

Year-long (August 2017 to August 2018) temperature records from two hydrothermal vents (“A” and “B”) in the Deep Hole area of Yellowstone Lake.
Year-long (August 2017 to August 2018) temperature records from two hydrothermal vents (“A” and “B”) in the Deep Hole area of Yellowstone Lake.

Crested Pool, in Upper Geyser Basin near Castle Geyser. Geyser Hill is in the background, and Old Faithful is the steaming feature at the upper right. USGS photo by Mike Poland, October 12, 2020.
Crested Pool, in Upper Geyser Basin near Castle Geyser. Geyser Hill is in the background, and Old Faithful is the steaming feature at the upper right. USGS photo by Mike Poland, October 12, 2020.

graphic showing volume of acre foot on football field
graphic showing volume of acre foot on football field

graphic showing gallons in a cubic foot

Panoramic photo of Pocket Basin, a hydrothermal explosion crater in Yellowstone National Park's Lower Geyser Basin, taken from the northeast rim looking southwest into the crater. Pocket Basin is a U-shaped crater that is dissected on the SW edge by the Firehole River, visible on the far-right of the photo.
Panoramic photo of Pocket Basin, a hydrothermal explosion crater in Yellowstone National Park's Lower Geyser Basin, taken from the northeast rim looking southwest into the crater. Pocket Basin is a U-shaped crater that is dissected on the SW edge by the Firehole River, visible on the far-right of the photo.
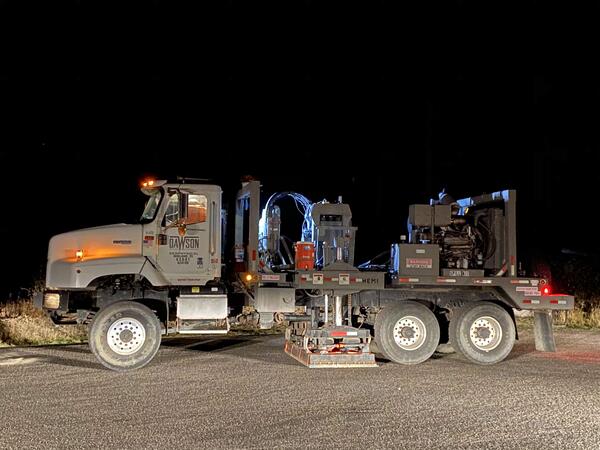
A 53,000-pound vibroseis truck, with a hydraulic vibration plate that creates signals like tiny earthquakes. The truck is parked at a roadside pullout near the Continental Divide in Yellowstone National Park. Photo by Jamie Farrell, University of Utah, September 2020, taken under Yellowstone National Park research permit YELL-2020-SCI-8146.
A 53,000-pound vibroseis truck, with a hydraulic vibration plate that creates signals like tiny earthquakes. The truck is parked at a roadside pullout near the Continental Divide in Yellowstone National Park. Photo by Jamie Farrell, University of Utah, September 2020, taken under Yellowstone National Park research permit YELL-2020-SCI-8146.

View of dead lodgepole pine trees with “bobby socks” from having taken up hydrothermal water that contains dissolved silica and other minerals. Photo taken south of the Fountain Paint Pot Trail in Lower Geyser Basin, Yellowstone National Park, looking toward the southeast. USGS photo by Stanley Mordensky, August 28, 2020.
View of dead lodgepole pine trees with “bobby socks” from having taken up hydrothermal water that contains dissolved silica and other minerals. Photo taken south of the Fountain Paint Pot Trail in Lower Geyser Basin, Yellowstone National Park, looking toward the southeast. USGS photo by Stanley Mordensky, August 28, 2020.