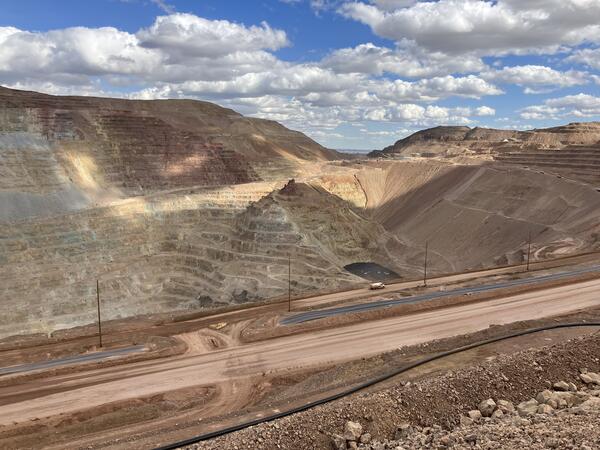
Ray_copper_mine_USGS_Mark_Cocker_revised_Aug_30_2024.jpg
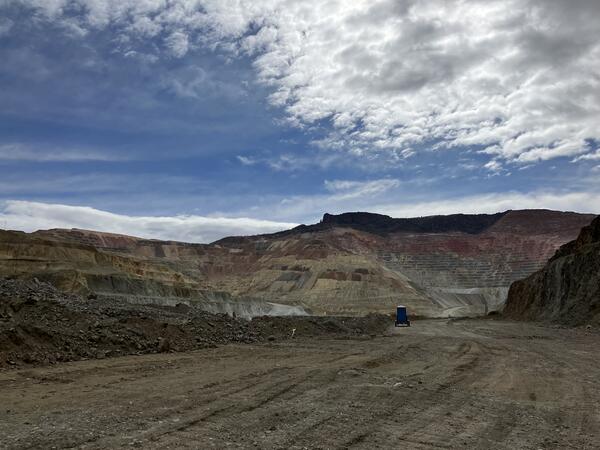
Ray_copper_mine_USGS_Mark_Cocker_revised_Aug_30_2024.jpgPhotograph of Ray Copper Mine, Arizona, taken by USGS Emeritus Mark Coker, September 1, 2007. Revised for USGS Webpage carousel for brightness, sharpness, contrast, color saturation, and cropping.