
Bathymetric map of offshore Oregon with Stonewall, Heceta, and Siltcoos Banks labeled.
Images
Pacific Coastal and Marine Science Center images.
Filter Total Items: 1361

Bathymetric map of offshore Oregon
Bathymetric map of offshore Oregon with Stonewall, Heceta, and Siltcoos Banks labeled.

Bathymetric map of offshore Washington
Bathymetric map of offshore Washington reveals seafloor features and submarine canyons.
Bathymetric map of offshore Washington reveals seafloor features and submarine canyons.

Cascadia megathrust fault map
Topo-bathymetric map of the Cascadia subduction zone. Cascadia megathrust fault (white line); approximate shelf break along 200-m isobath (yellow line); MTJ, Mendocino triple junction.
Topo-bathymetric map of the Cascadia subduction zone. Cascadia megathrust fault (white line); approximate shelf break along 200-m isobath (yellow line); MTJ, Mendocino triple junction.

Elwha River delta
View looks southwest along the eastern flank of the Elwha River delta and back towards the mouth of the river. USGS conducts regular surveys along this stretch of coastline, to monitor the evolving coastline following removal of the Elwha and Glines Canyon Dams, completed in 2014.
View looks southwest along the eastern flank of the Elwha River delta and back towards the mouth of the river. USGS conducts regular surveys along this stretch of coastline, to monitor the evolving coastline following removal of the Elwha and Glines Canyon Dams, completed in 2014.

Taking PPE to a whole new level
You have to be able to have a little fun when in the field. A colleague from the Washington State Department of Ecology hams it up while prepping for a beach survey with scientists from the USGS Pacific Coastal and Marine Science Center.
You have to be able to have a little fun when in the field. A colleague from the Washington State Department of Ecology hams it up while prepping for a beach survey with scientists from the USGS Pacific Coastal and Marine Science Center.

Fort Stevens State Park
Photo of surf zone offshore of Fort Stevens State Park taken from the Columbia River South Jetty observation deck.
Photo of surf zone offshore of Fort Stevens State Park taken from the Columbia River South Jetty observation deck.

EXPRESS surveys, dives, and sampling locations
The west coast of the United States showing locations of EXPRESS ship-based multibeam surveys, ROV dives, AUV dives, and sediment samples. Red boxes show locations of close-up views of multibeam bathymetry in Figures 2 and 3.
The west coast of the United States showing locations of EXPRESS ship-based multibeam surveys, ROV dives, AUV dives, and sediment samples. Red boxes show locations of close-up views of multibeam bathymetry in Figures 2 and 3.

Figure 5 offshore Morro Bay seafloor detail
Colored shaded-relief bathymetry including pockmarks offshore Morro Bay, California. Map generated from AUV-based multibeam bathymetry data collected by MBARI.
Colored shaded-relief bathymetry including pockmarks offshore Morro Bay, California. Map generated from AUV-based multibeam bathymetry data collected by MBARI.

Trinidad submarine canyon bathymetry
Colored, shaded-relief bathymetry of Trinidad Submarine Canyon northwest of Humboldt Bay in northern California. Area is in the vicinity of a potential offshore renewable energy development. See larger map for location.
Colored, shaded-relief bathymetry of Trinidad Submarine Canyon northwest of Humboldt Bay in northern California. Area is in the vicinity of a potential offshore renewable energy development. See larger map for location.

Figure 4 offshore Morro Bay seafloor detail
Colored shaded-relief bathymetry including submarine channels and pockmarks offshore Morro Bay, California. Map generated from AUV-based multibeam bathymetry data collected by MBARI both prior to and as a part of EXPRESS.
Colored shaded-relief bathymetry including submarine channels and pockmarks offshore Morro Bay, California. Map generated from AUV-based multibeam bathymetry data collected by MBARI both prior to and as a part of EXPRESS.

Offshore central California bathymetry
Colored, shaded-relief bathymetry offshore central California. Data supported management of National Marine Sanctuaries and prospective renewable energy decisions. Black ovals are locations of AUV-based multibeam surveys. Close-up views of two AUV surveys are shown in Figures 4 and 5.
Colored, shaded-relief bathymetry offshore central California. Data supported management of National Marine Sanctuaries and prospective renewable energy decisions. Black ovals are locations of AUV-based multibeam surveys. Close-up views of two AUV surveys are shown in Figures 4 and 5.

The new face of fieldwork
Marine technician Dan Powers, from the Pacific Coastal and Marine Science Center's Marine Facility (PCMSC MarFac), wears all the required personal protective equipment: bib waders, personal floatation device, and mask.
Marine technician Dan Powers, from the Pacific Coastal and Marine Science Center's Marine Facility (PCMSC MarFac), wears all the required personal protective equipment: bib waders, personal floatation device, and mask.

Overview of Taan Fiord
Overview of Taan Fiord. Inset showing location of Taan Fiord, Alaska in Wrangell St. Elias National Park and Preserve. Taan Fiord is about 100 km from the nearest town, Yakutat, AK. Landsat 8 image of Taan Fiord acquired in 2016. Vegetation loss is clear near the water line.
Overview of Taan Fiord. Inset showing location of Taan Fiord, Alaska in Wrangell St. Elias National Park and Preserve. Taan Fiord is about 100 km from the nearest town, Yakutat, AK. Landsat 8 image of Taan Fiord acquired in 2016. Vegetation loss is clear near the water line.

Personal watercraft equipped with sonar and GPS
A USGS scientist navigates a personal watercraft (PWC) slowly through Elkhorn Slough. The PWC is equipped with an echosounder and GPS, to record accurate depth and location. This mapping effort is part of recurring surveys in the Monterey Bay area.
A USGS scientist navigates a personal watercraft (PWC) slowly through Elkhorn Slough. The PWC is equipped with an echosounder and GPS, to record accurate depth and location. This mapping effort is part of recurring surveys in the Monterey Bay area.

Collecting nearshore bathymetry data off Rio del Mar
Collecting nearshore bathymetry data off Rio del MarA USGS scientist navigates a personal watercraft equipped with sonar and GPS to collect depth information (bathymetry) of the nearshore. This mapping effort is part of recurring surveys in the Monterey Bay area.

Collecting beach profile data with GPS
A USGS scientist walks along Santa Cruz Main Beach at the edge of the San Lorenzo River in Santa Cruz, California, wearing a backpack with GPS equipment. She is collecting elevation data that will be used to create a topographic map of the beach. This mapping effort is part of recurring surveys in the Monterey Bay area.
A USGS scientist walks along Santa Cruz Main Beach at the edge of the San Lorenzo River in Santa Cruz, California, wearing a backpack with GPS equipment. She is collecting elevation data that will be used to create a topographic map of the beach. This mapping effort is part of recurring surveys in the Monterey Bay area.

Field equipment for bathymetric and topographic surveys
Field equipment for bathymetric and topographic surveysField equipment used by USGS Pacific Coastal and Marine Science Center scientists for bathymetric and topographic surveys in the Sacramento-San Joaquin Delta, California
Field equipment for bathymetric and topographic surveys
Field equipment for bathymetric and topographic surveysField equipment used by USGS Pacific Coastal and Marine Science Center scientists for bathymetric and topographic surveys in the Sacramento-San Joaquin Delta, California

Thermal image of ocean and groundwater
Thermal infrared image of two USGS researchers standing on the coastline and looking out (up on the image) over a coastal groundwater plume that is non-visible to the naked eye but can be observed in this thermal image due to the temperature differences between the cooler (blue) groundwater and warmer (pink) ocean water over the coral reefs.
Thermal infrared image of two USGS researchers standing on the coastline and looking out (up on the image) over a coastal groundwater plume that is non-visible to the naked eye but can be observed in this thermal image due to the temperature differences between the cooler (blue) groundwater and warmer (pink) ocean water over the coral reefs.

Aerial image of Searsville Dam and Lake
Aerial image of Searsville Dam and Lake near Stanford, California, taken during coring operations in February 2020.
Aerial image of Searsville Dam and Lake near Stanford, California, taken during coring operations in February 2020.
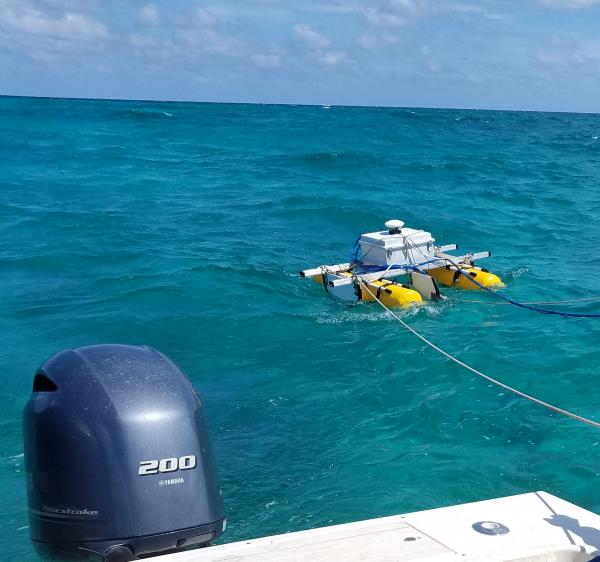
SQUID-5 - Structure-from-Motion Quantitative Underwater Imaging Device
SQUID-5 - Structure-from-Motion Quantitative Underwater Imaging DeviceThe SQUID-5, or a Structure-from-Motion (SfM) Quantitative Underwater Imaging Device with 5 cameras is a towed surface vehicle with an onboard Global Navigation Satellite System (GNSS) and 5 downward-looking cameras with overlapping views of the seafloor.

State of Our Nation’s Coast Stakeholder Engagement Workshop
State of Our Nation’s Coast Stakeholder Engagement WorkshopParticipants of the Coastal Change Hazards State of Our Nation’s Coast stakeholder engagement workshop at the Waquoit Bay National Estuarine Reserve in Falmouth, MA. Participants are pictured here talking in small groups.