MEET A FIRE SCIENTIST: Steven Sobieszczyk.
I fill two roles with wildfires. I go out after a fire to look at values at risk to postfire flooding or I respond during a fire as public information officer.

Official websites use .gov
A .gov website belongs to an official government organization in the United States.
Secure .gov websites use HTTPS
A lock () or https:// means you’ve safely connected to the .gov website. Share sensitive information only on official, secure websites.
Images

MEET A FIRE SCIENTIST: Steven Sobieszczyk.
I fill two roles with wildfires. I go out after a fire to look at values at risk to postfire flooding or I respond during a fire as public information officer.
MEET A FIRE SCIENTIST: Steven Sobieszczyk.
I fill two roles with wildfires. I go out after a fire to look at values at risk to postfire flooding or I respond during a fire as public information officer.

Drew Robinson, a USGS hydrological technician, is putting a Rapid Deployment Gauge together for the Georgia Department of Transportation on Wednesday, August 7. He built the RDG and deployed it in Statesboro in the early evening. That RDG was used to help the local community experiencing bad floods on Lotts Creek.
Drew Robinson, a USGS hydrological technician, is putting a Rapid Deployment Gauge together for the Georgia Department of Transportation on Wednesday, August 7. He built the RDG and deployed it in Statesboro in the early evening. That RDG was used to help the local community experiencing bad floods on Lotts Creek.

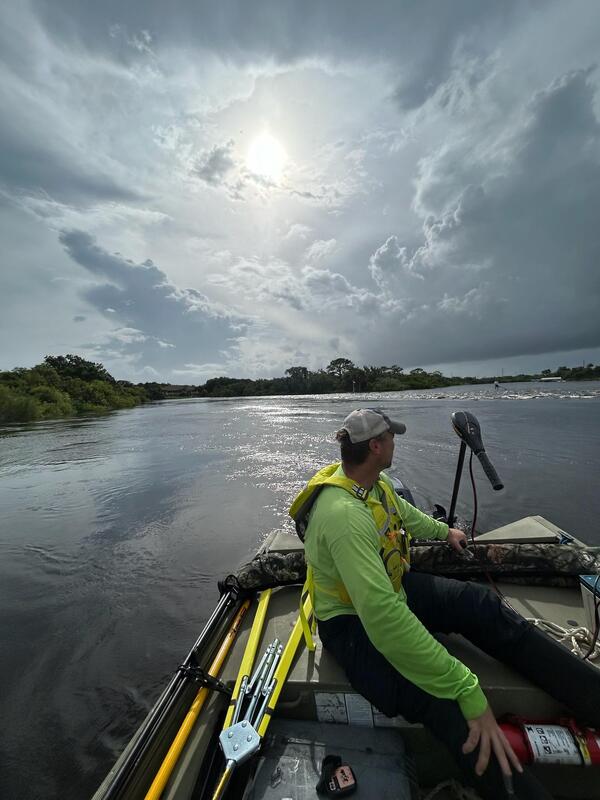
Nick Stanton, a U.S. Geological Survey hydrologic technician, takes floodwater measurements on a road overtopped with water near Parrish, Fla., Aug. 6, 2024 just days after Tropical Storm Debby struck Florida's Gulf Coast. (Photo by Patrick Marasco, USGS).
Nick Stanton, a U.S. Geological Survey hydrologic technician, takes floodwater measurements on a road overtopped with water near Parrish, Fla., Aug. 6, 2024 just days after Tropical Storm Debby struck Florida's Gulf Coast. (Photo by Patrick Marasco, USGS).

U.S. Geological Survey hydrologic technician Todd Dunkle takes high water measurements with a remote-controlled boat in Clearwater, Fla. Aug. 5, 2024, hours after Tropical Storm Debby made landfall along Florida's western coast. (Photo by Mike Ludwig).
U.S. Geological Survey hydrologic technician Todd Dunkle takes high water measurements with a remote-controlled boat in Clearwater, Fla. Aug. 5, 2024, hours after Tropical Storm Debby made landfall along Florida's western coast. (Photo by Mike Ludwig).
U.S. Geological Survey hydrologic technician Don Hampton traverses Ward Lake in Bradenton, Fla., to take high water measurements on Aug. 6, 2024 in the aftermath of Tropical Storm Debby. (Photo by Vinny Budd, USGS).
U.S. Geological Survey hydrologic technician Don Hampton traverses Ward Lake in Bradenton, Fla., to take high water measurements on Aug. 6, 2024 in the aftermath of Tropical Storm Debby. (Photo by Vinny Budd, USGS).

U.S. Geological Survey hydrologic technician Graham Murray installs a rapid deployment gauge Aug. 6, 2024 at Big Reedy Creek near Latta, South Carolina, to measure floodwaters in the wake of Tropical Storm Debby. (USGS photo).
U.S. Geological Survey hydrologic technician Graham Murray installs a rapid deployment gauge Aug. 6, 2024 at Big Reedy Creek near Latta, South Carolina, to measure floodwaters in the wake of Tropical Storm Debby. (USGS photo).

National Hurricane Center satellite imagery, August 5, 2024, shows Hurricane Debby near Florida.
National Hurricane Center satellite imagery, August 5, 2024, shows Hurricane Debby near Florida.
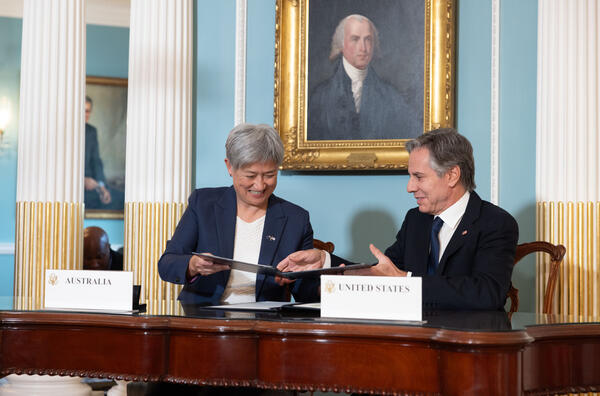
Minister for Foreign Affairs, Penny Wong, and U.S. Secretary of State, Antony Blinken, with the signed bilateral statement on the Landsat Next program.
Minister for Foreign Affairs, Penny Wong, and U.S. Secretary of State, Antony Blinken, with the signed bilateral statement on the Landsat Next program.

Devin Moore, left, a U.S. Geological Survey intern and Tennessee State University graduate student, assists a 2024 TSU Summer Apprenticeship Program participant in wetlands research. (Courtesy photo).
Devin Moore, left, a U.S. Geological Survey intern and Tennessee State University graduate student, assists a 2024 TSU Summer Apprenticeship Program participant in wetlands research. (Courtesy photo).

Students participating in the 2024 cohort of Tennessee State University's Summer Apprenticeship Program take a field trip to Mammoth Cave National Park, Kentucky. (Courtesy photo).
Students participating in the 2024 cohort of Tennessee State University's Summer Apprenticeship Program take a field trip to Mammoth Cave National Park, Kentucky. (Courtesy photo).

Animated Ash3D simulation of a volcanic ash cloud from a hypothetical eruption of Mt. St. Helens, WA if it occurred today. Colors represent ash concentrations in the cloud. This .gif is uploaded to Drupal to support Volcano modeling feature story in support of the September’s theme of hazard resilient communities.
Animated Ash3D simulation of a volcanic ash cloud from a hypothetical eruption of Mt. St. Helens, WA if it occurred today. Colors represent ash concentrations in the cloud. This .gif is uploaded to Drupal to support Volcano modeling feature story in support of the September’s theme of hazard resilient communities.

Students participating in Tennessee State University's Summer Apprenticeship Program process water samples in a laboratory during the 2024 cohort. (Courtesy photo).
Students participating in Tennessee State University's Summer Apprenticeship Program process water samples in a laboratory during the 2024 cohort. (Courtesy photo).

Andrea Jaegge, far left, a USGS postdoctoral biologist, instructs Tennessee State University students participating in the school's 2024 cohort of the Summer Apprenticeship Program, on how to use a epifluorescent microscope to view algae (Courtesy photo).
Andrea Jaegge, far left, a USGS postdoctoral biologist, instructs Tennessee State University students participating in the school's 2024 cohort of the Summer Apprenticeship Program, on how to use a epifluorescent microscope to view algae (Courtesy photo).

National Hurricane Center satellite imagery of the Gulf of Mexico on August 5, 2024.
National Hurricane Center satellite imagery of the Gulf of Mexico on August 5, 2024.

Alison Rose, Chief of Space Division, Geoscience Australia, and Darcee Killpack, acting Associate Director, Core Science Systems, United States Geological Survey, signing the Memorandum of Understanding formally operationalizing the Landsat Next partnership.
Alison Rose, Chief of Space Division, Geoscience Australia, and Darcee Killpack, acting Associate Director, Core Science Systems, United States Geological Survey, signing the Memorandum of Understanding formally operationalizing the Landsat Next partnership.

Red flag warnings are issued when weather conditions become hot, dry, and windy. These conditions are ideal for wildfires to start or grow.
Red flag warnings are issued when weather conditions become hot, dry, and windy. These conditions are ideal for wildfires to start or grow.

Minister for Foreign Affairs, Penny Wong, and U.S. Secretary of State, Antony Blinken, with the signed bilateral statement on the Landsat Next program.
Minister for Foreign Affairs, Penny Wong, and U.S. Secretary of State, Antony Blinken, with the signed bilateral statement on the Landsat Next program.

Animated D-Claw simulation of a hypothetical landslide and lahar originating from the failure of a section of the Tahoma Glacier headwall at Mt. Rainier, WA. This .gif is uploaded to Drupal to support Volcano modeling feature story in support of the September’s theme of hazard resilient communities.
Animated D-Claw simulation of a hypothetical landslide and lahar originating from the failure of a section of the Tahoma Glacier headwall at Mt. Rainier, WA. This .gif is uploaded to Drupal to support Volcano modeling feature story in support of the September’s theme of hazard resilient communities.

Thomas Byl, far left, a U.S. Geological Survey biologist and professor at Tennessee State University, poses with a group of TSU's Summer Apprenticeship Program students as they prepare to do some wetlands science. (Courtesy photo).
Thomas Byl, far left, a U.S. Geological Survey biologist and professor at Tennessee State University, poses with a group of TSU's Summer Apprenticeship Program students as they prepare to do some wetlands science. (Courtesy photo).

U.S. Geological Survey biologist Thomas Byl, foreground, leads students participating in Tennessee State University's 2024 cohort of the Summer Apprenticeship Program. (Courtesy photo).
U.S. Geological Survey biologist Thomas Byl, foreground, leads students participating in Tennessee State University's 2024 cohort of the Summer Apprenticeship Program. (Courtesy photo).
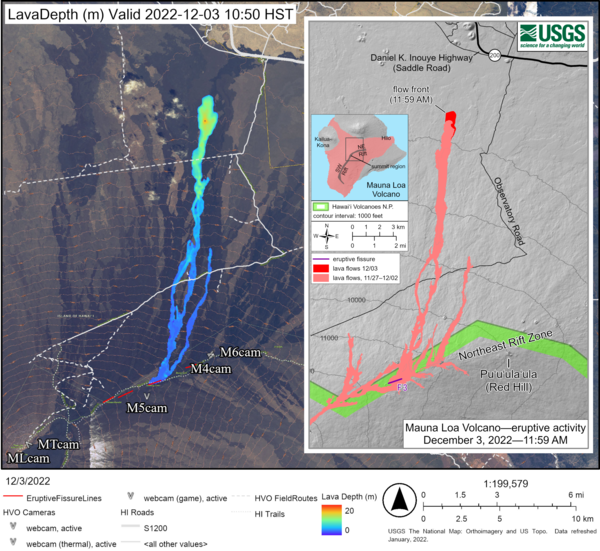
Lava2d simulation of the fissure 3 lava flow from the 2022 eruption of Mauna Loa, Hawaiʻi. Colors represent lava flow depth after 5 days of activity.
Lava2d simulation of the fissure 3 lava flow from the 2022 eruption of Mauna Loa, Hawaiʻi. Colors represent lava flow depth after 5 days of activity.