Fire Danger Forecast Viewer
3 Fire-related Maps
- Wildfire Potential
- Probability of Large Fire
- Probability of Fire Spread

Official websites use .gov
A .gov website belongs to an official government organization in the United States.
Secure .gov websites use HTTPS
A lock () or https:// means you’ve safely connected to the .gov website. Share sensitive information only on official, secure websites.
Images

Fire Danger Forecast Viewer
3 Fire-related Maps
Fire Danger Forecast Viewer
3 Fire-related Maps

There are three fire-related triangles used to explain fire growth and expansion. The smallest scale "Fire Triangle" factors in oxygen, heat, and fuel. The "Fire Behavior Triangle" factors in topography, fuel, and weather. While the large-scale "Fire Regime Triangle" factors in ignition source, vegetation, and climate.
There are three fire-related triangles used to explain fire growth and expansion. The smallest scale "Fire Triangle" factors in oxygen, heat, and fuel. The "Fire Behavior Triangle" factors in topography, fuel, and weather. While the large-scale "Fire Regime Triangle" factors in ignition source, vegetation, and climate.

World map of expected annual disruption of copper refinery production, in metric tons, from potential seismic activity.
World map of expected annual disruption of copper refinery production, in metric tons, from potential seismic activity.

A bat box, photographed as part of NABat fieldwork in 2024.
A bat box, photographed as part of NABat fieldwork in 2024.

Andrea Schuhmann removes a bat from a mist net during NABat Fieldwork in 2024.
Andrea Schuhmann removes a bat from a mist net during NABat Fieldwork in 2024.

MEET A FIRE SCIENTIST: Miguel Villarreal, Ph.D.
I study how wildfires affect landscapes and determine ways we can reduce community risk and help the environment recover after a fire.
MEET A FIRE SCIENTIST: Miguel Villarreal, Ph.D.
I study how wildfires affect landscapes and determine ways we can reduce community risk and help the environment recover after a fire.

A screenshot of the U.S. Geological Survey's costal change hazards portal, indicates the forecast of Tropical Storm Beryl's impact on the coast of Texas. The three red lines indicate the collision, wave and water sand dune overwash, and dune inundation.
A screenshot of the U.S. Geological Survey's costal change hazards portal, indicates the forecast of Tropical Storm Beryl's impact on the coast of Texas. The three red lines indicate the collision, wave and water sand dune overwash, and dune inundation.

Graphic showing Earth observation inputs found in the 2023 USGEO Earth observation assessment for agriculture and forestry.
Graphic showing Earth observation inputs found in the 2023 USGEO Earth observation assessment for agriculture and forestry.

Cover image for Elevation gain | Wetland loss animation. stylized water with a berm and wind cloud
Cover image for Elevation gain | Wetland loss animation. stylized water with a berm and wind cloud

USGS water data expert Garret Welsh measures water flow in the pouring rain at the Straight River near Faribault, Minnesota. This measurement recorded the 6th highest flow in the station's 59-year history, highlighting the severity of current flood conditions. Such data is crucial for emergency managers and forecasters to protect communities at risk.
USGS water data expert Garret Welsh measures water flow in the pouring rain at the Straight River near Faribault, Minnesota. This measurement recorded the 6th highest flow in the station's 59-year history, highlighting the severity of current flood conditions. Such data is crucial for emergency managers and forecasters to protect communities at risk.

Rock detentions structures installed as natural infrastructure in dryland streams (NIDS); photo by Laura M. Norman, USGS
Rock detentions structures installed as natural infrastructure in dryland streams (NIDS); photo by Laura M. Norman, USGS

Screenshot showing the use of the topoBuilder application to create on demand topographic maps. Step one select a map.
Screenshot showing the use of the topoBuilder application to create on demand topographic maps. Step one select a map.

Screenshot showing the use of the topoBuilder application to create on demand topographic maps, customize map.
Screenshot showing the use of the topoBuilder application to create on demand topographic maps, customize map.

Screenshot showing the use of the topoBuilder application to create on demand topographic maps. Edit cart.
Screenshot showing the use of the topoBuilder application to create on demand topographic maps. Edit cart.

Screenshot showing the use of the topoBuilder application to create on demand topographic maps, edit map.
Screenshot showing the use of the topoBuilder application to create on demand topographic maps, edit map.

This is a 1:2,000,000-scale map of Arizona with the entire Arizona National Scenic Trail shown in red. The basemap is the USGS Topo basemap taken from USGS The National Map.
This is a 1:2,000,000-scale map of Arizona with the entire Arizona National Scenic Trail shown in red. The basemap is the USGS Topo basemap taken from USGS The National Map.
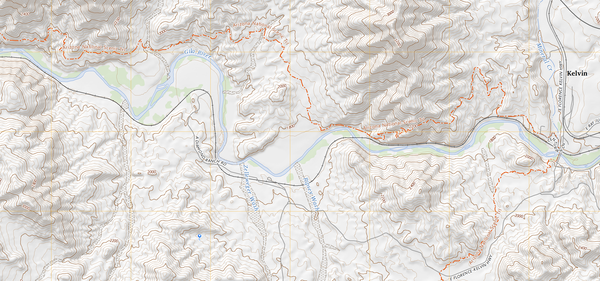
A 7.5-Minute Topo or 1:24,000 scale map of the Arizona National Scenic Trail runs through the Gila River Canyons west of the town of Kelvin. This map shows shaded relief, contour lines, hydrography, land cover, place names, and roads.
A 7.5-Minute Topo or 1:24,000 scale map of the Arizona National Scenic Trail runs through the Gila River Canyons west of the town of Kelvin. This map shows shaded relief, contour lines, hydrography, land cover, place names, and roads.

This is a close-up of a 1:100,000-scale topographic map (100K Topo) of the Arizona National Scenic Trail (AZ NST) from the Kaibab Plateau at top to the Grand Canyon North Rim at bottom. The AZ NST is highlighted in red. This map shows contour lines, hydrography, landform names, land cover, federal lands, roads, and structures.
This is a close-up of a 1:100,000-scale topographic map (100K Topo) of the Arizona National Scenic Trail (AZ NST) from the Kaibab Plateau at top to the Grand Canyon North Rim at bottom. The AZ NST is highlighted in red. This map shows contour lines, hydrography, landform names, land cover, federal lands, roads, and structures.

Rock Core 12 sample in Carbonate Aquifer Characterization Lab.
Photographed by Chrishera Smith.
Rock Core 12 sample in Carbonate Aquifer Characterization Lab.
Photographed by Chrishera Smith.

Infographic description features and function of micro ocean-bottom seismometers.
Infographic description features and function of micro ocean-bottom seismometers.

There are three fire-related triangles used to explain fire growth and expansion. The smallest scale "Fire Triangle" factors in oxygen, heat, and fuel. The "Fire Behavior Triangle" factors in topography, fuel, and weather. While the large-scale "Fire Regime Triangle" factors in ignition source, vegetation, and climate.
There are three fire-related triangles used to explain fire growth and expansion. The smallest scale "Fire Triangle" factors in oxygen, heat, and fuel. The "Fire Behavior Triangle" factors in topography, fuel, and weather. While the large-scale "Fire Regime Triangle" factors in ignition source, vegetation, and climate.