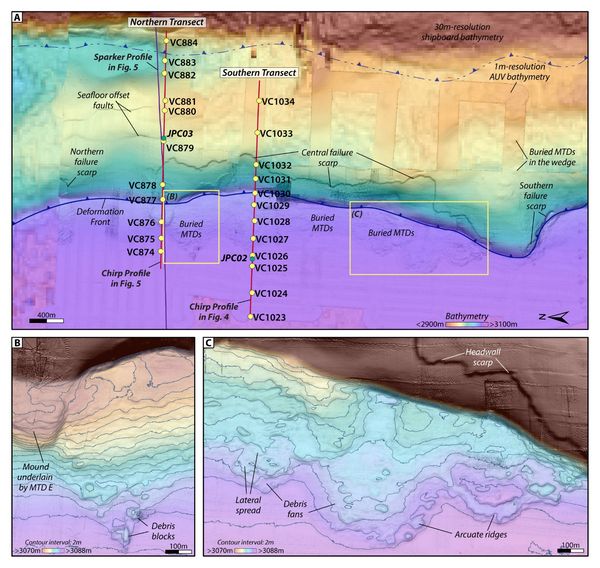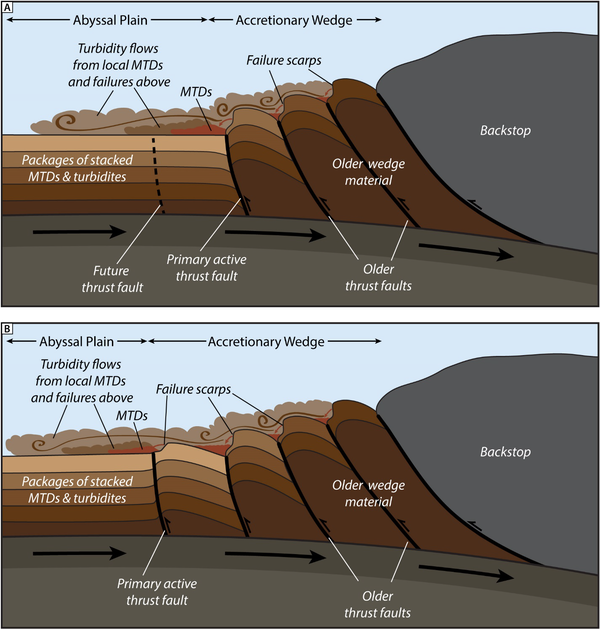
Geologic model for abyssal seismoturbidite generation along the Cascadia Subduction Zone
Geologic model for abyssal seismoturbidite generation along the Cascadia Subduction ZoneGeologic model for abyssal seismoturbidite generation along the Cascadia Subduction Zone. (A) With each earthquake cycle, slope failures occur on the oversteepened limbs of thrust folds in the accretionary wedge, resulting in proximal MTDs and turbidity flows that spread out across the abyssal plain.