
Natural Disaster Preparedness Starts with Science
The USGS Coastal and Marine Hazards and Resources Program provides information needed to protect coastal communities
Whether you get updates about natural disasters from the news, a website, or an app, the accuracy of that information depends on the quality of the science behind it. The USGS provides the trusted scientific foundation that decision makers and communities rely on to prepare for coastal hazards.
When preparing for natural disasters, people rightfully have a lot of questions.
Should I evacuate? What precautions should I take? Will my neighborhood flood? How bad will conditions be in my area? How long will this last?
The answers to these questions come from science. And that’s where USGS comes in.
The USGS Coastal and Marine Hazards and Resources Program provides research, data, and actionable products needed to effectively plan and prepare for natural disasters along the coast, such as hurricanes, tsunamis, and offshore earthquakes. By studying past events and the dynamics of coastal and marine processes, we learn where hazards may occur in the future, the likelihood of their occurrence, and the potential impacts to people, property, and resources on a regional to national basis.
USGS scientists use the information and data collected to develop and improve hazard forecast models and decision-support tools. We also deliver this research directly to our partners and specific users, such as State and local emergency managers, National Oceanic and Atmospheric Administration (NOAA), National Weather Service, U.S. Army Corps of Engineers (USACE), and the Federal Emergency Management Agency (FEMA). In addition to using USGS products to prepare for natural disasters along the coast, our stakeholders also ingest USGS data into their own models, forecasts, and tools.
Regardless of where you choose to receive trusted information about an incoming natural disaster, preparedness starts with rigorous science. The USGS is known for producing information that is credible, reliable, and impartial. Without this foundation of Gold Standard Science, hazard forecasts would be much less accurate and trustworthy, leaving decision makers ill-equipped to prepare for the devastating consequences of natural disasters along the coast.
Behind the Scenes: USGS Science for Natural Disaster Preparedness Along the Coast
Hurricanes
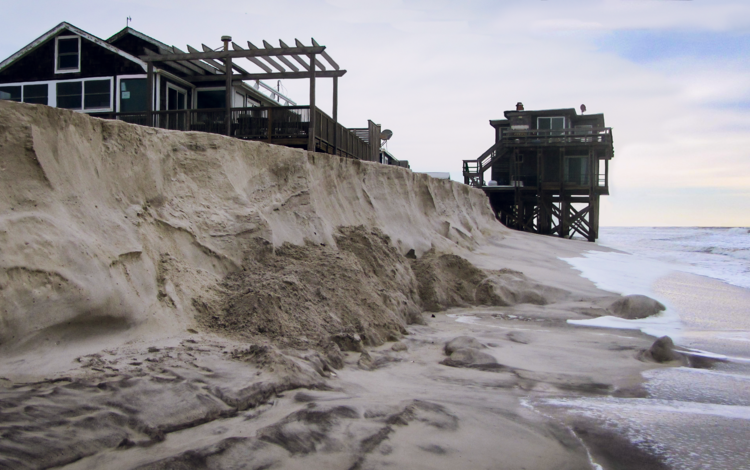
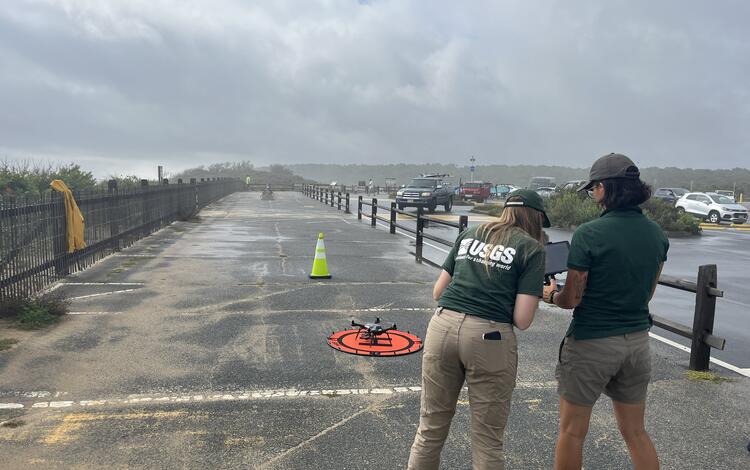
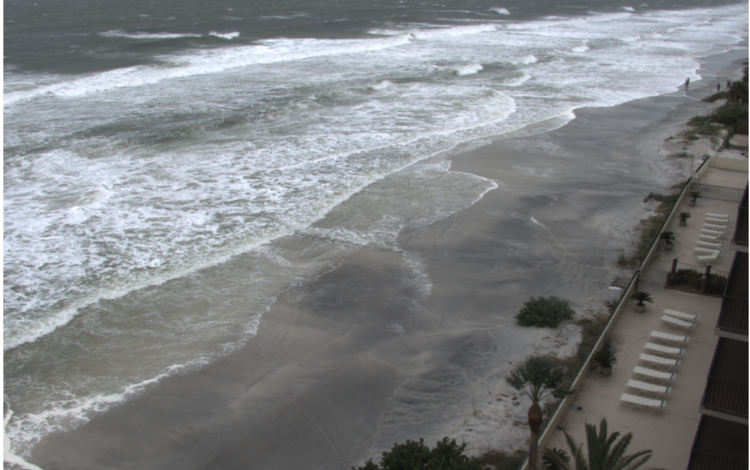
When a hurricane or tropical storm is approaching, the USGS activates the Coastal Storm Response Team to collect valuable data and forecast the storm’s path, intensity, and potential coastal hazards.
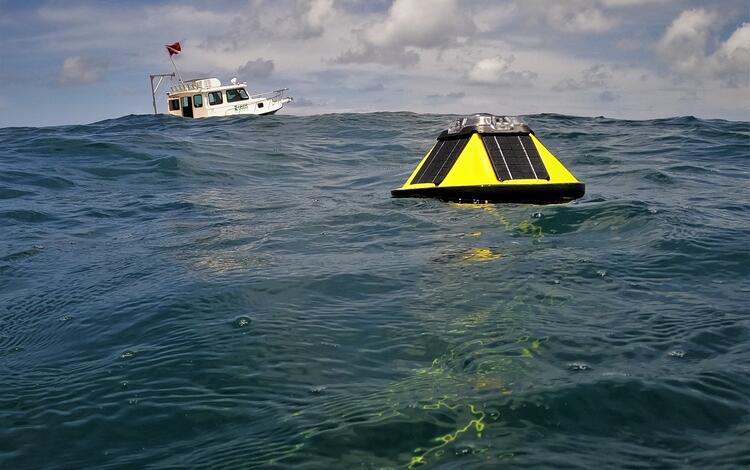
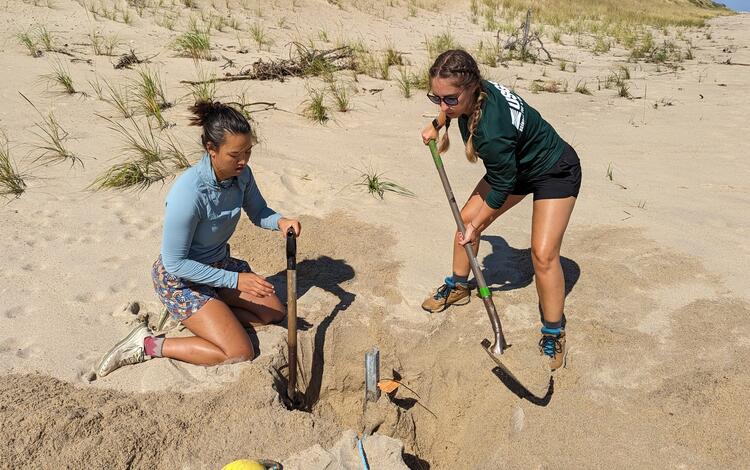
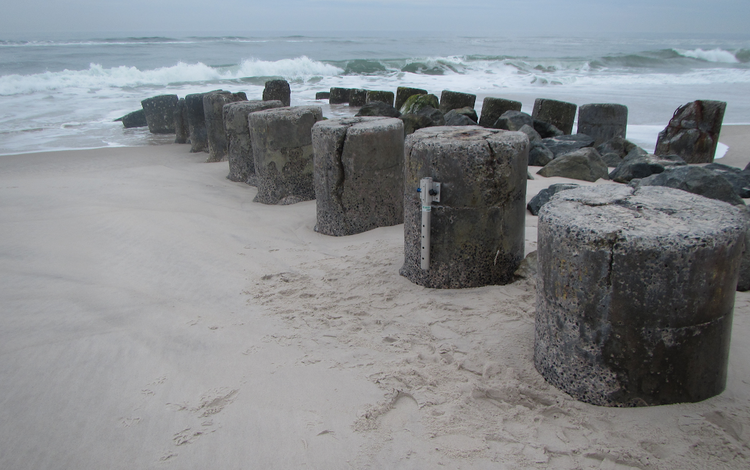
Before the storm hits, we often take aerial photos of the coastal areas likely to be impacted and conduct GPS surveys to map coastal features, monitor landscape change and erosion, and provide detailed elevation and positional data. Pressure sensors are installed on the shore to measure storm surge and flooding caused by the hurricane. Buoys with sensors can be deployed in the ocean ahead of the storm to measure waves, temperature, and physical ocean properties in real-time. Forecasts and real-time data are accessible through the Coastal Change Hazards Portal, Total Water Level and Coastal Change Forecast Viewer, and other USGS emergency management tools.
When the storm passes, the sensors on land and offshore are collected for data analysis. Post-storm more aerial photos can be taken, and GPS surveys can be conducted to create before-and-after topographic maps and 3D comparison models. Using these maps and models, we identify where and how the coastal landscape changed as a result of the storm. These products can be processed rapidly to assist partners, such as state agencies, FEMA, and the National Park Service, with emergency response. The maps and 3D comparison models, combined with the data collected by sensors and surveys, are also used to evaluate and improve the accuracy of USGS coastal change models that forecast storm conditions and potential coastal hazards. The information gained from each storm is analyzed and made available via data releases and journal articles so it can be used by other scientists, research organizations, and coastal practitioners.
This ‘behind the scenes’ coastal change and storm research is crucial to inform decisions that increase preparedness, enhance resilience, and reduce risks to people, infrastructure, and the economy.


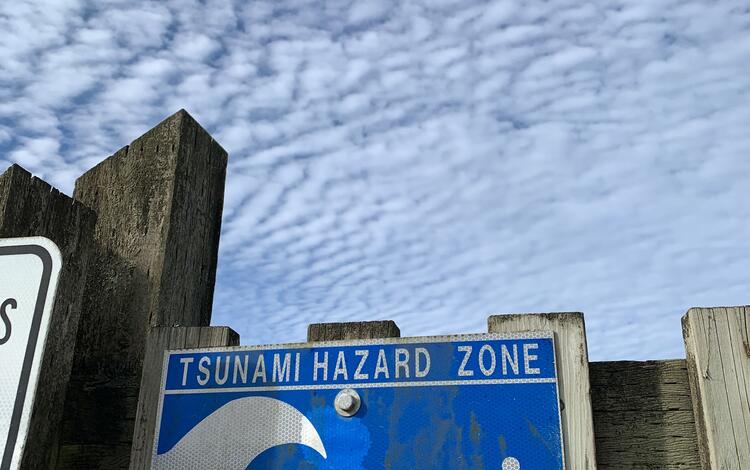
Earthquakes, Landslides, and Tsunamis
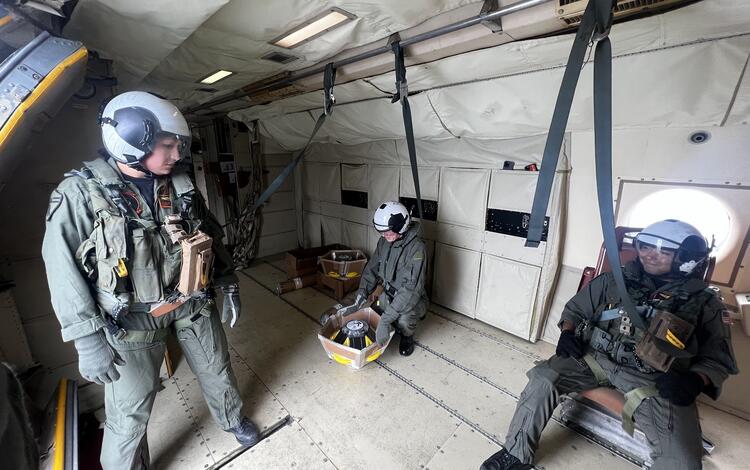
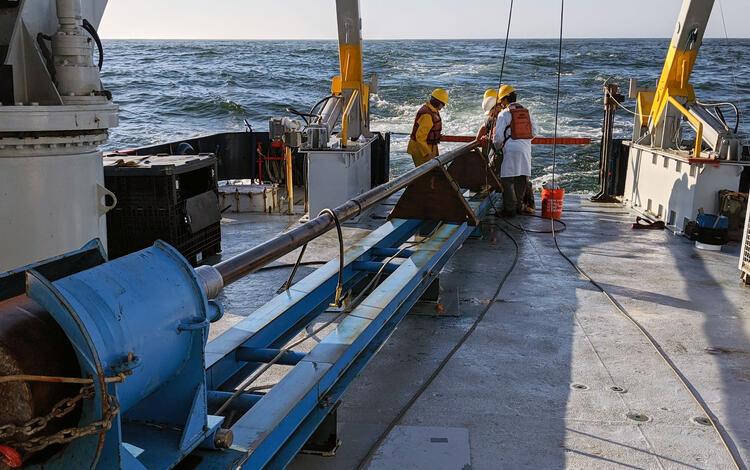
When a seismic event occurs underwater, our fleet of rapid response seismographs are swiftly deployed to record the speed and shape of seismic waves. These data help scientists determine the magnitude of earthquakes, locate the seismic source, image the structure of the fault zone, and model stress changes. This information is needed to better understand the impact of the seismic event, asses the risk of further damage, and improve future preparedness. The goal is to mobilize and deploy the fleet within two weeks of a marine seismic event to ensure we collect data during periods of exceptionally high scientific value. The first real-world deployment of the fleet took place in December 2024 in response to a magnitude 7.0 earthquake offshore Northern California. The fleet was deployed within just 11 days of the event—the fastest response in U.S. history. This rapid response ocean-bottom seismograph fleet, developed and maintained in partnership with the Woods Hole Oceanographic Institution, represents a significant advancement in natural hazards research.
When an active seismic event is not occurring, we conduct ongoing research of the seafloor surface and subsurface, especially in subduction zones where the most powerful earthquakes, landslides, tsunamis, and volcanic eruptions occur, to learn more about these hazards and their underlying processes.
High-resolution maps of the seafloor allow our scientists to identify geological features associated with marine hazards. This helps determine which regions are at increased risk and from which hazards. For example, fault lines (fractures in the Earth’s crust where rocks have moved past each other) can indicate risk of earthquakes, while broken down gas hydrates (crystalline solids formed of water and gas) can be indicators of seafloor instability that may lead to underwater landslides.
Our detailed maps of the seafloor subsurface and marine sediment core samples provide insights into past seismic events and their frequency. This information helps us better understand the geologic processes that lead to hazards and the spatial extent of various risks to people and onshore and offshore infrastructure.
USGS scientists also use traditional ocean-bottom seismographs—instruments that are much larger, heavier, and more long-lasting on the seafloor than our rapid response fleet—for long-term research lasting months to years. These instruments are typically deployed in areas prone to seismic activity to collect data on geological processes that occur over extended periods of time.
Using the data collected during active seismic events, as well as the data on geological features, processes, and historical records, the USGS assesses the probability of marine hazards and develops models to estimate risk. These data and models are essential for policymakers, engineers, and coastal practitioners to make informed decisions regarding hazard risk zoning, building codes, and disaster preparedness. The critical decisions they make using our research can save lives and mitigate consequences to important infrastructure and the economy.


While we are not the people on your television telling you what to do in the face of a natural disaster, preparedness, emergency management decisions, and risk reduction guidance starts with science like ours.

Related

Cascadia Subduction Zone Marine Geohazards

California Seafloor Mapping Program

Coastal and Marine Geohazards of the U.S. West Coast and Alaska

Atlantic and Gulf of America Submarine Landslides-Tsunami Hazards Project

Sea Floor Mapping Group

Caribbean Tsunami and Earthquake Hazards Studies
Related
Cascadia Subduction Zone Marine Geohazards
California Seafloor Mapping Program
Coastal and Marine Geohazards of the U.S. West Coast and Alaska
Atlantic and Gulf of America Submarine Landslides-Tsunami Hazards Project
Sea Floor Mapping Group