
Hurricane Ian took a tragic toll on lives, property, and coastal environments in southwest Florida and the South Atlantic coast of the U.S. Scientists at USGS are analyzing the event to better understand how extreme storms impact our coasts, so we can be better prepared for the next one.

Hurricane Ian was among the strongest storms to ever hit the United States, according to the National Environmental Satellite Data and Information Service. Ian’s winds reached a maximum sustained speed of 155 mph, just shy of a Category 5 storm, driving 12 to 18 feet of storm surge—the highest recorded in Southwest Florida in the past 150 years. These factors led to tens of billions of dollars in estimated damage. Ian made landfall west of Fort Myers, Florida, on September 28, 2022, as a Category 4 storm with a second landfall occurring in South Carolina on September 30.
In addition to tragic loss of life, devastating flooding, and wind damage, the storm caused severe coastal change—eroding away coastal habitats and infrastructure, collapsing bridges, damaging homes, and making roadways impassable—along hundreds of miles of Florida and the U.S. coastline.
Before, during, and after the storm, USGS brings together expertise across multiple disciplines to predict and analyze coastal impacts. These data help enhance predictions of coastal change and provide a better understanding of coastal dynamics during storms so that communities can be better prepared for hurricanes in the future. Almost as if reflecting the rapid intensification of Hurricane Ian, a multidisciplinary team at USGS ramped up scientific efforts upon Ian’s approach to amplify our knowledge on storm-driven coastal hazards.
The Calm Before the Storm
As storms are approaching U.S. coastlines, the USGS Coastal Change Hazards team goes into preparation mode. USGS staff organize collections of pre-storm images of potentially impacted coastal areas, deploy numerous instruments to monitor the storm’s effects, and initiate models that are used to forecast the impacts of the storm.
While Hurricane Ian brewed over the Gulf of America in late September 2022, the Remote Sensing Coastal Change team organized existing aerial imagery and scheduled flights to collect updated images as a pre-storm reference. They contracted an aircraft to fly along the coast and take thousands of overlapping images. The USGS Remote Sensing team then stitched together these images to create a highly accurate and detailed model of the coast, known as orthomosaics and 3-dimensional maps. These images were collected again once the storm passed to create before-and-after 3D models of coastal change. These before and after comparisons are critical for scientists to measure how the coast has changed and to evaluate how accurately USGS models predicted locations of where these changes would occur. Evaluating the “skill” of these models and updating coastal elevation data helps scientists improve the forecasts so they are more accurate for future storms.


“Remote sensing is an important field for those of us studying coastal change at USGS and the Department of the Interior. Applying machine-learning techniques to orthomosaics and satellite imagery allows us to characterize coastal change across an enormous spectrum—from the planetary scale to the tiniest grains of sand on a beach.”
-- Jon Warrick, USGS Research Geologist at the Pacific Coastal and Marine Science Center
Simultaneously, the USGS Water Science Centers worked to deploy water level sensors along the Florida, Georgia, and South Carolina coasts. The magnitude of Ian necessitated an immense number of sensors to collect critical data. More than 50 employees worked to deploy over 400 sensors in 2 days to collect an unprecedented amount of data for this extremely destructive storm.
Predictions and Partnerships in Ian’s Path

Every day, USGS provides forecasts of coastal change in real time for almost 3,000 miles of U.S. Atlantic and Gulf of America beaches. This forecast becomes especially important when a tropical storm is approaching. The forecasts show how high water levels could reach relative to protective dunes and barrier islands. What makes this forecast unique compared to other storm forecasts is that it incorporates not just tides and storm surge, but also the wind-driven waves – which can be an extremely destructive part of a storm. Waves on top of storm surge can cause an immense amount of damage to inland areas and displace sediments, homes, equipment, and infrastructure. Although these models are focused on sandy beaches, they provide a good indication of what kind of effects may be felt further inland.
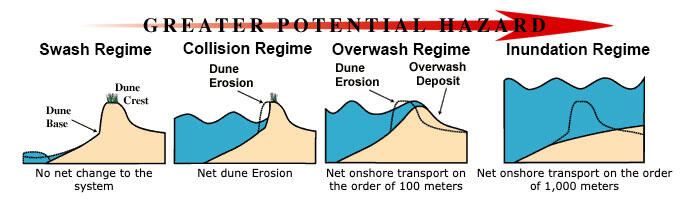
During the least severe form of coastal change, elevated water levels can cause erosion, when sand is taken away from the beach and dunes. If even higher, water can push sand from the dunes further inland—a process called overwash—potentially blocking roadways and damaging homes and infrastructure. The most damaging effect is inundation—when storm surge and waves exceed the height of the dunes and are consistently present behind the dunes. USGS models can predict where and when these changes are likely to occur and displays these predictions via the Total Water Level and Coastal Change Forecast Viewer.
Our partnership with the National Oceanic and Atmospheric Administration is critical for maintaining these forecasts. USGS coastal change forecasts are included in the Advanced Weather Interactive Processing System (AWIPS) – the system used by National Weather Service meteorologists, and provided daily to federal partners, such as the Federal Emergency Management Agency (FEMA) and the U.S. Army Corps of Engineers, during a storm’s approach.
As part of the National Oceanographic Partnership Program (NOPP), USGS works with partners to increase our knowledge of how storms impact and shape our coasts. While Hurricane Ian was approaching, a team deployed cross-shore transects of instruments at two locations within the cone of uncertainty to record how conditions changed while the storm passed through. These instruments included oceanographic buoys, water level and wave sensors secured to the end of piers and on the beach (in addition to those deployed by the USGS Water Science Centers). These sensors were able to record an impressive amount of information, capturing data at frequent time intervals at these locations of interest, and allow researchers to better describe the spatial variability of the storm’s surge and wave-driven impacts. The data collected are being used to assess numerical models being run as part of the NOPP project, including real-time predictions and hindcast simulations. These simulations will allow scientists to determine which aspects of the storm are most important for accurately predicting hazardous impacts at the coastline.


Upon Ian’s approach, staff also began running models such as the Coupled Ocean-Atmosphere-Waves-Sediment Transport (COAWST) Modeling System to predict maximum wave heights and direction at 3-day increments across the Gulf of America and Atlantic Ocean. COAWST is an open-source model that more accurately predicts storm paths and intensities. It joins together models that represent the ocean, atmosphere, waves, sediment transport, hydrology, and sea ice. By creating a system that allows these various models to feed back to one another, storm simulations depict a more realistic suite of physical storm processes.
“The advantages of using a coupled system have become apparent because the Earth is controlled by interconnected systems. Forecast modelers have realized that hurricane predictions were more accurate when feedback from the ocean and waves was included. Coastal zone predictions of surge and erosion will be improved by using full ocean simulations rather than simplified physics.”
-- John Warner, Oceanographer and COAWST project lead at the USGS Woods Hole Coastal and Marine Science Center
Explore how the COAWST modeling system was used during Hurricane Florence in this interactive geonarrative.
These forecasts can help coastal communities prepare for and recover from storms like Hurricane Ian, inform emergency managers making critical decisions for risk reduction, and can also be used by the public for making everyday decisions even during calm periods or when a storm is far offshore but sending waves to the beach. This can help coastal residents be aware of when their favorite beach parking lot or coastal highway could be flooded or covered in sand—even on a sunny day.
The Silver Lining: A Clearer Understanding of Storm Impacts
In response to Hurricane Ian, the U.S. Geological Survey is investing additional resources to further assess the storm’s impacts. In addition to dedicated research, this effort will advance capacities to more effectively engage with stakeholders across the areas of impact and determine how USGS data could be used to better inform coastal communities faced with storms like this in the future.
After the hurricane passed, USGS measured impacts to the coastline using several methods. The Coastal Change Hazards teams gathered imagery, including NOAA emergency response imagery, and sent out a team to collect additional overlapping photos of the coast to create 3D models of the altered coastal landscape. These high-resolution maps are used to identify where coastal change occurred and are compared against the pre-storm coastal change forecasts to assess their accuracy. Depending on the storm and its areas of impact, some of these images and data are processed rapidly in order to assist partners, such as state agencies, FEMA, and the National Park Service, with emergency response.


“While Hurricane Ian was undoubtedly catastrophic, there is a ‘scientific silver lining’ in that this storm provided an opportunity to learn more about how these storms work, how they impact our coasts, and how we can improve our science to be better prepared for future disasters.”
-- Meg Palmsten, Research Oceanographer at the USGS St. Petersburg Coastal and Marine Science Center
Extreme storms like Hurricane Ian are unquestionably devastating. As USGS responds to events like these, we continue to build the science that can help reduce risk as communities better plan for, and recover from, future storms.

Photo by Danielle Faletti. Used with Permission.
To learn more about USGS’s role in providing science to decision-makers before, during, and after Hurricane Ian, visit https://www.usgs.gov/special-topics/hurricane-ian.
Subscribe to the Sound Waves Newsletter to stay updated on coastal and marine news from across the USGS!
Related
USGS Hurricane Ian Page
USGS Hurricane Resources
Coastal Hazards and Resilience

COAWST: A Coupled-Ocean-Atmosphere-Wave-Sediment Transport Modeling System

Remote Sensing Coastal Change

Coastal Change Hazards

National Assessment of Coastal Change Hazards

Operational Total Water Level and Coastal Change Forecasts

Video Remote Sensing of Coastal Processes

Hurricanes and Storm-Tide Monitoring
Related
USGS Hurricane Ian Page
USGS Hurricane Resources
Coastal Hazards and Resilience
COAWST: A Coupled-Ocean-Atmosphere-Wave-Sediment Transport Modeling System
Remote Sensing Coastal Change
Coastal Change Hazards
National Assessment of Coastal Change Hazards
Operational Total Water Level and Coastal Change Forecasts
Video Remote Sensing of Coastal Processes