
USGS Seafloor Mapping Provides the Scientific Foundation Needed to Address National Priorities
Seafloor mapping provides the fundamental data needed to study a wide range of topics. The USGS is actively mapping the seafloor surface and its underlying structure in coastal to deep sea environments to address national priorities.
Maps of the seafloor provide the scientific foundation needed to address a variety of national priorities, including public safety, national security, energy dominance, and economic prosperity.
The USGS creates highly detailed maps of the seafloor surface, as well as the geological structure beneath it. This mapping combination is essential to fully understand and predict hazards associated with hurricanes, tsunamis, and offshore earthquakes and landslides, identify marine resources such as critical minerals and sand/gravel, investigate potential offshore energy sources, and so much more.
Emergency and resource managers, government agencies, policy makers, scientists, and private industries all rely on our robust seafloor mapping data to make decisions and accomplish specific goals that benefit our Nation.
How is Seafloor Mapping Used to Address National Priorities?
Public Safety
Seafloor mapping plays a crucial role in increasing public safety by identifying and predicting hazards associated with the marine environment. By providing critical information about underwater hazards, storm impacts, and navigation safety, these maps empower communities, emergency managers, and policymakers to make informed decisions that protect lives.
Natural Hazards
Creating detailed maps of the seafloor surface and subbottom (sediment and rock layers beneath the surface) allows us to assess the probability of marine hazards, such as earthquakes, underwater landslides, and tsunamis.
Identifying geological features associated with marine hazards reveals which regions are at increased risk and from which particular hazard. For instance, fault lines (fractures in the Earth’s crust where rocks have moved past each other) can indicate risk of earthquakes, while broken down gas hydrates (crystalline solids formed of water and gas) and pockmarks (seafloor depressions) can be indicators of seafloor instability that may lead to underwater landslides.
Our subbottom maps also provide insights into past geological events. This helps us better understand the geologic processes that lead to hazards and the spatial extent and distribution of various risks.
Using these various data on geological features, processes, and historical records, we can identify potential hazards, learn more about how different hazards might interact, and assess the probability of their occurrence.
USGS Example:
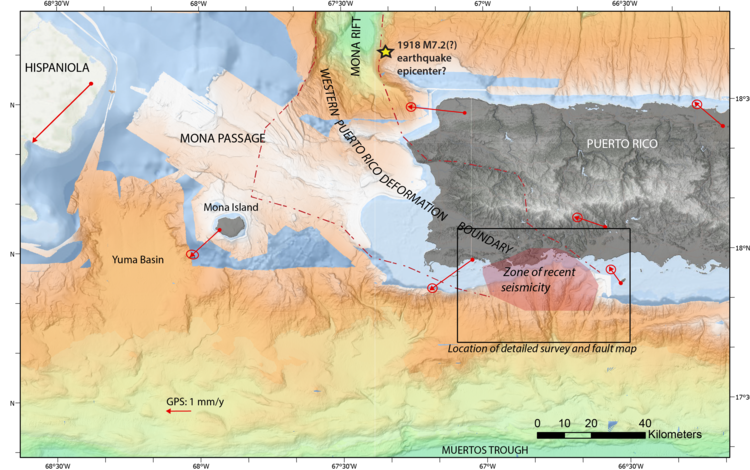
The USGS led a study along the Queen Charlotte Fault offshore Southeast Alaska and British Columbia to study this major transform boundary between the Pacific and North American plates. The primary goal of the study was to gain a better understanding of the earthquake, tsunami, and underwater-landslide hazards throughout southeastern Alaska, as well as gather data to develop geologic models that can be applied to similar plate boundaries around the globe, such as the San Andreas fault system in southern California, the Alpine fault in New Zealand, and the North Anatolian fault in Turkey.
Read our story titled, “Mapping the Entire Queen Charlotte-Fairweather Fault System,” to learn more.


Storm Surge and Flood Modeling
Seafloor mapping provides data needed for modeling the behavior of storm surge during hurricanes and other extreme storms. The seafloor’s shape and geological features in a given area influence wave dynamics and water levels. By ingesting this data into coastal change hazard models, we create more accurate storm simulations and improve forecast models.
Emergency managers and planners use these models to identify vulnerable areas during a storm and develop more effective strategies to protect communities from storm surge, flooding, and coastal erosion.
USGS Example:
The Coupled Ocean-Atmosphere-Wave-Sediment Transport (COAWST) modeling system is a tool that predicts many aspects of storm dynamics. The coupled modeling system can simultaneously run several, individual models representing the ocean, atmosphere, waves, sediment transport, hydrology, and sea ice. By creating a system that allows these various models to feed back to one another, storm simulations depict a more realistic suite of physical processes such as water level, wave heights, and the vertical structure of the ocean temperature, salinity, and currents that contribute to storm development and result in potential hazards to coastal communities.
Visit the project web page or the COAWST Daily Forecast geonarrative to learn more.

Ship Navigation Safety
Accurate seafloor maps help ensure safe navigation for commercial shipping and recreational boating by providing information about underwater hazards such as submerged rocks, shipwrecks, and shallow areas.
Mariners use this information to determine safe navigation routes that avoid these hazardous features that are otherwise invisible from the ocean’s surface. Using seafloor maps helps avoid maritime accidents, keeping people safe and reducing the risk of catastrophic incidents like oil spills.
USGS Example:
Cape Cod Bay is a major shipping route and is used for commercial and recreational fishing, whale watching, and more. The USGS produced the first-ever comprehensive, high-resolution geophysical survey of Cape Cod Bay. This is the first systematic bathymetric mapping of the entire Bay since the 1930’s. Geophysical data collected include swath bathymetry, backscatter, and seismic reflection profile data. Ground-truth data, including sediment samples, underwater video, and bottom photographs were also collected. These data offer an unprecedented view of the Bay’s seafloor and subseafloor.
Read our article titled, “Cape Cod Bay Seafloor Mapping Data Available!” to learn more and access the data release.


National Security
Mapping the seafloor is necessary to ensure national security because it informs military planning and defense strategies, provides data needed to safeguard crucial coastal infrastructure and assets, and helps identify critical minerals and other important resources offshore.
Military Planning and Defense
Understanding the complexities of the seafloor helps military planners assess safe navigation paths for vessels, allowing them to avoid submerged obstacles that could impede operations.
Additionally, seafloor maps are needed to make decisions about military infrastructure. Underwater infrastructure, such as submarine cables and pipelines, are vital for military communications and operational logistics. There are also many military installations located on our coasts that are essential to our Nation’s defense strategy. Seafloor maps can be used to identify and model potential threats to this infrastructure, such as areas prone to natural disasters and coastal change. Using this information, military planners can devise strategies to protect these critical assets.
Seafloor maps also support the identification of potential adversary assets, helping to assess threats and develop countermeasures.
USGS Example:
The Department of Defense partnered with the USGS to better understand future coastal landscape changes that are and will continue to impact military installations, defense access roads, and Sentinel Landscapes along the U.S. Atlantic and Gulf Coasts. The Department of Defense requires this knowledge to meet statutory requirements in Title 10, U.S. Code. Understanding the location and timing of these changes and resulting impacts (e.g., inundation or erosion), enables the development of proactive strategies to protect assets, investments, and resources that ensure the prosperity of the Nation and its citizens.
Learn more by reading our article titled, “USGS Coastal Landscape Change Products Help the U.S. Department of Defense Safeguard Military Infrastructure Along the Coast.”

Critical Minerals and Other Offshore Resources
Many mineral resources and metals are vital to our Nation’s national security. For example, they are necessary manufacturing components for military hardware throughout the defense industrial base, including fighter jets and submarines. The USGS has analyzed supply chains for these materials to develop the whole of government List of Critical Minerals. The list, due to be revised before the end of the year, currently includes 50 minerals whose supply must be assured to avoid significant consequences to the United States economy and national security. Out of those 50 minerals, 37 can be found on or below the seafloor.
Seafloor maps provide the foundation needed to identify and characterize these critical resources offshore. They help us understand how and where they form, what conditions contribute to their growth, how long it takes for them to accumulate, where other similar minerals and resources might occur, and the potential environmental signals associated with their extraction. The ocean covers approximately 71% of the Earth’s surface. Without these maps, exploratory expeditions would use an extraordinary amount of time and resources trying to locate resources.
USGS Example:
The Global Marine Mineral Resources project studies deep ocean minerals that occur within the U.S. Exclusive Economic Zone and areas beyond national jurisdictions. The project aims to provide stakeholders with the best available science regarding potential resources and environmental impacts associated with accessing those resources. While there are a wide variety of deep-sea mineral categories, the project focuses on those marine mineral categories that have the greatest resource potential.
Visit the project web page to learn more.


Energy Dominance
As onshore energy reserves become depleted or more challenging to access, investigating potential offshore energy sources is crucial. Seafloor maps help identify and assess areas that may contain valuable resources such as oil and natural gas by providing detailed images and data about the geological structures beneath the seafloor.
Offshore Oil and Gas Reserves
Mapping the seafloor subbottom reveals features like faults, sediment layers, and reservoir formations. Understanding these geological structures can help pinpoint where oil and natural gas are likely trapped, as these resources often accumulate in porous rock formations beneath impermeable layers.
3D visualizations of the seafloor and its underlying geology also provides invaluable data for assessing the economic viability of offshore energy projects, as it informs decisions about drilling locations and extraction methods.
Additionally, understanding the geological context of these energy resources through seafloor mapping helps mitigate risks associated with offshore drilling. By identifying potential hazards, such as unstable sediments or nearby fault lines, energy companies can better plan their operations to avoid environmental disasters.
USGS Example:
Gas hydrates are crystalline solids made of water and gas. It can look and feel much like ice but contains huge amounts of methane. With support from the U.S. Department of Energy, the USGS has led natural gas hydrate research for over 30 years in the deep sea and permafrost areas. We conduct mapping to better understand gas hydrate distribution, characterize methane hydrate deposits, and expand the number of known seafloor methane seeps. One of our key research goals is investigating the potential of gas hydrate as an energy resource. In 2024, we participated in the world’s first-ever long-term production test near Prudhoe Bay, Alaska—an important next step toward demonstrating gas hydrate’s potential as an energy resource. We are evaluating the test results to determine if gas hydrates are a viable energy resource for our Nation.
Explore the Gas Hydrates project web page to learn more.


Economic Prosperity
Seafloor mapping provides the foundational information needed to improve hazard preparedness and identify critical resources, helping to promote safety, save money, and drive economic growth.
Hazard Preparedness
Damage caused by natural hazards cost our country billions of dollars each year. For example, hurricanes and coastal storms cost an average of \$22.8 billion in damages per event and earthquakes cost the Nation about \$14.7 billion in building damages and associated losses.1 Seafloor maps help identify areas vulnerable to natural disasters such as hurricanes, tsunamis, and earthquakes. With this information, coastal communities can develop robust mitigation and emergency response plans, implement effective coastal management strategies, and invest in infrastructure that minimizes risk. By providing data to enable more effective planning and mitigation strategies, our Nation can save a significant amount of money in damages while protecting local economies and preserving livelihoods, property, and critical infrastructure.
USGS Example:
The USGS has various products that report near real-time coastal conditions and forecast an active storm’s path, intensity, and associated coastal change hazards. These tools provide local officials and emergency managers with the scientific information they need to help make decisions before a storm makes landfall.
Read our article titled, “Approaching Storms,” to learn more about specific tools, such as the Coastal Change Hazards Portal, Total Water Level and Coastal Change Forecast Viewer, and the Coastal Storm Modeling System (CoSMoS).


Commercially Important Fisheries
Seafloor maps help identify essential habitats, such as seagrass beds, reefs, and spawning grounds, that sustain commercially important fish populations. This information is needed to manage fisheries, monitor fish populations, and help fishermen choose ideal locations to fish. Seafloor maps also help ensure fishermen choose safe navigation routes. By ensuring the health of fish stocks and identifying prosperous fishing grounds, seafloor mapping supports the livelihoods of fishermen and the food supply chain, making it an integral part of economic prosperity in coastal communities.
USGS Example:
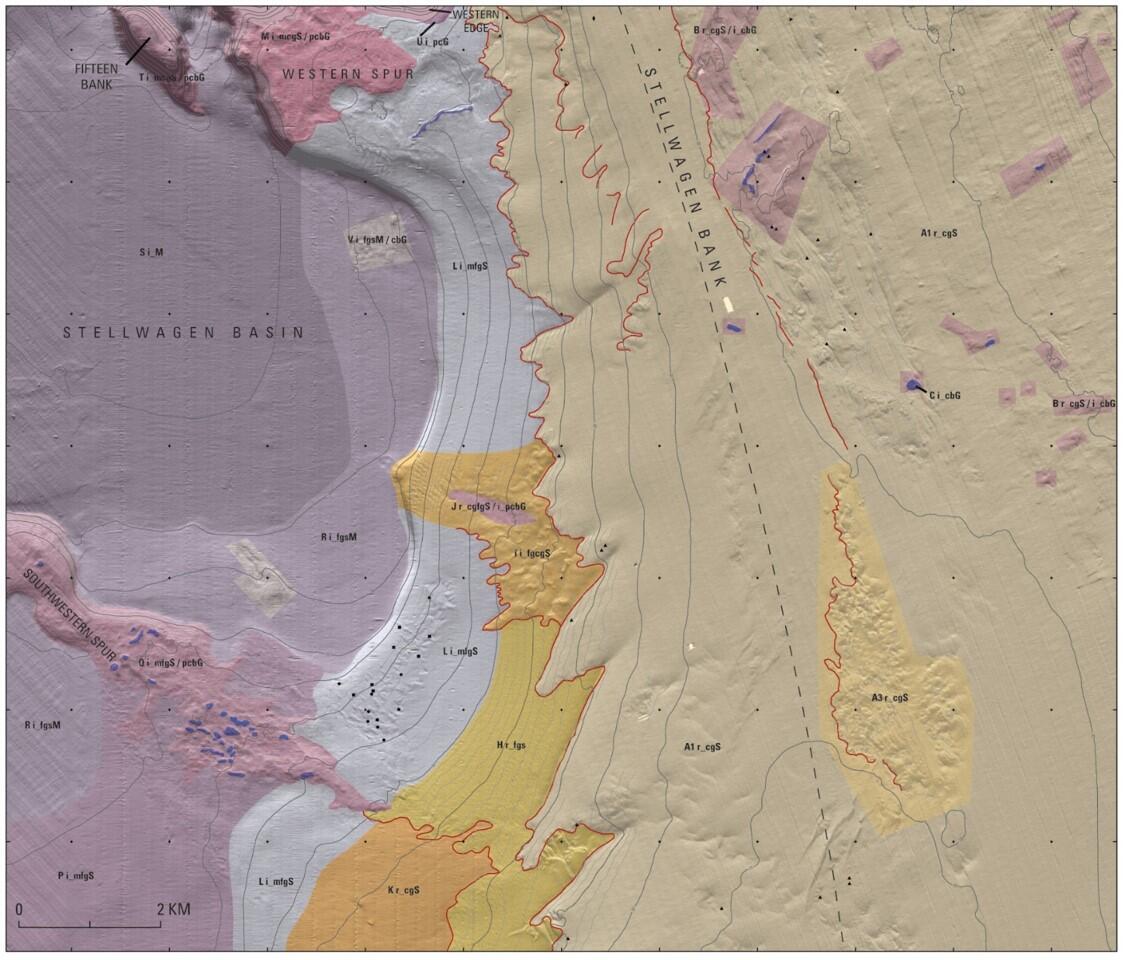
The National Sea-Floor Mapping and Habitat Studies—Atlantic project produces a series of interpretive maps showing the distribution of geologic seabed substrates and processes in the NOAA Stellwagen Bank National Marine Sanctuary 20 miles offshore Boston, Massachusetts. The maps provide a framework for scientific research in the region and for managing fishery resources and infrastructure. Stellwagen Bank is the principal habitat in the eastern Gulf of Maine for Ammodytes dubius (sand lance), a schooling fish that is the primary food resource for marine mammals, seabirds, and most of the bank’s commercial fishery species—including Gadus morhua (cod), Melanogrammus aeglefinus (haddock), and Thunnus thynnus (bluefin tuna). Geologic substrate mapping can determine the extent of suitable habitat for the species and provide a basis for assessing the size of the sand lance population and identifying its dependence on seasonal changes of water-column properties.
Visit the project web page to learn more.


Resource Extraction
Offshore resources are significant economic contributors and have the potential to contribute more. Mineral resources and metals are needed to manufacture technology and electronics, such as mobile batteries for power tools, smartphones, and vehicles. Sand, gravel, and other aggregates are basic raw materials used for construction, agriculture, and more. These resources are crucial to the U.S. economy. In fact, in 2023 alone, offshore minerals contributed \$77 billion in sales revenue.2 The aggregates industry generates nearly \$40 billion in sales annually.3 Detailed maps of the seafloor help identify these resources, as well as potential energy sources, and provide information needed for responsible extraction, helping to boost local and national economies.
USGS Example:
USGS scientists map, characterize, and sample the seafloor, helping to identify the areas most likely to contain important natural resources, including oil, gas, sand, and critical minerals. Our findings inform industry and state and Federal government, such as the Bureau of Ocean Energy Management, the U.S. Department of Energy, and the U.S. Army Corps of Engineers, how and where seabed resources form, and help provide the science they need to make decisions about harnessing these resources safely and responsibly.
Learn more by reading our article titled, “We Make Treasure Maps: USGS Charts the Seafloor to Help Locate Critical Minerals, Precious Metals, and Other Vital Resources.”

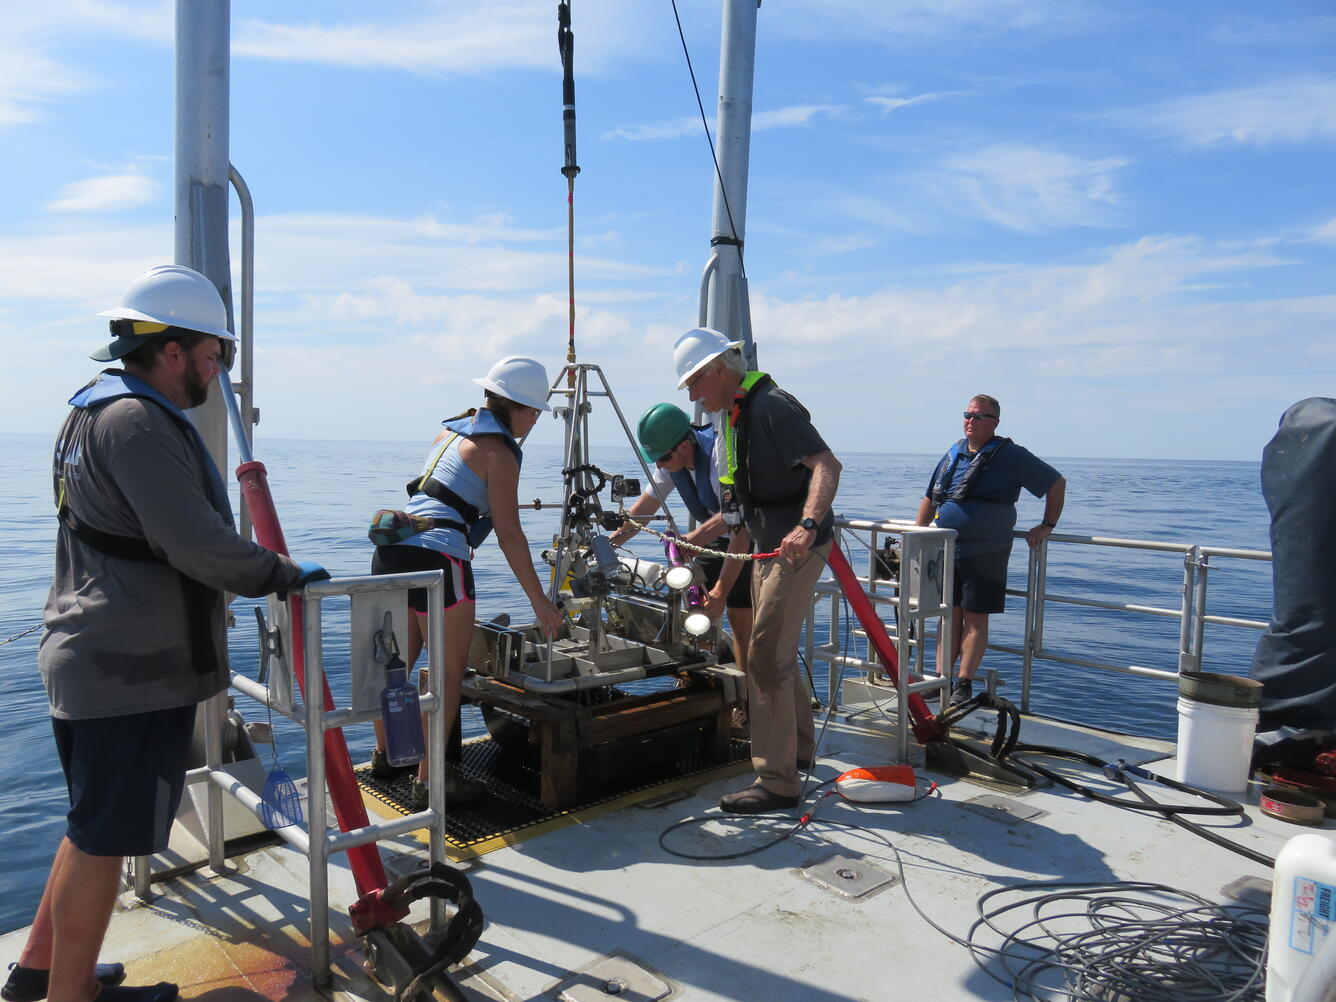
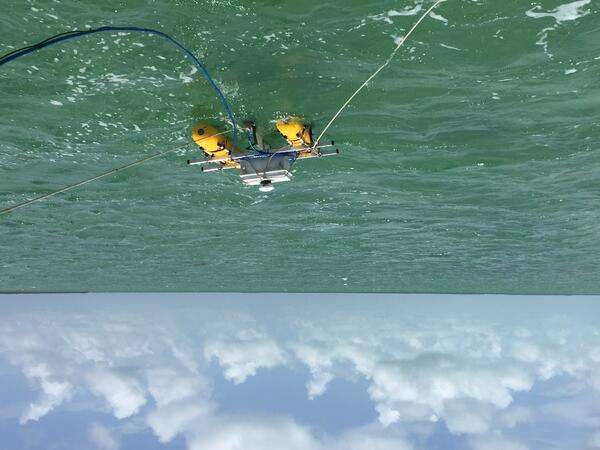
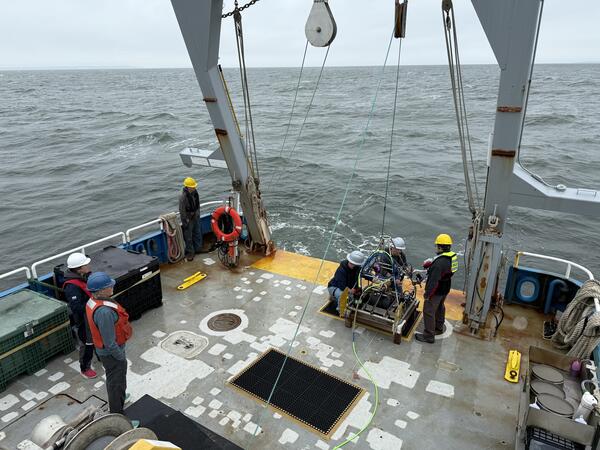
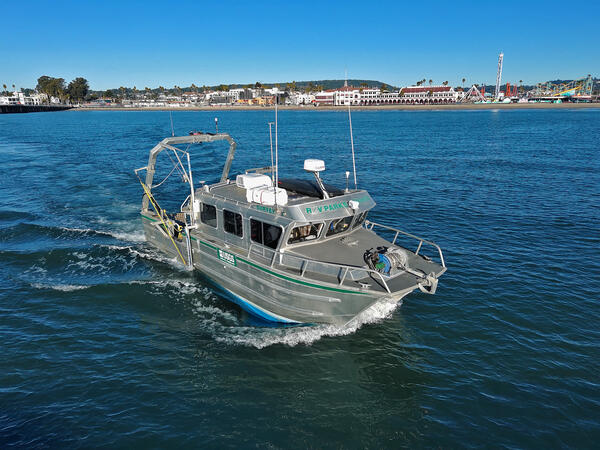
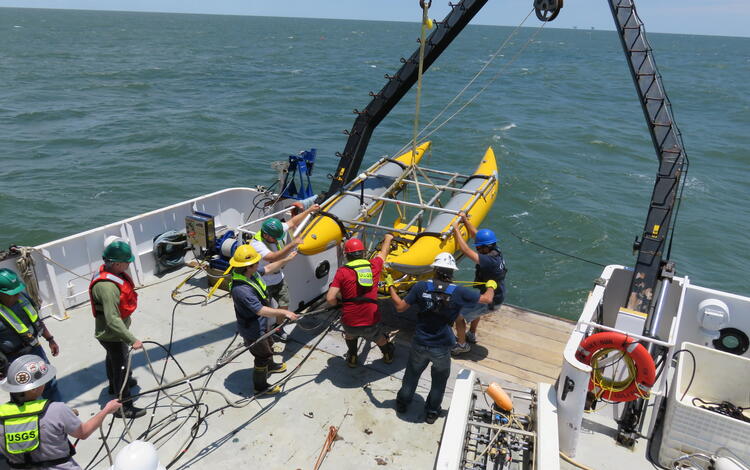
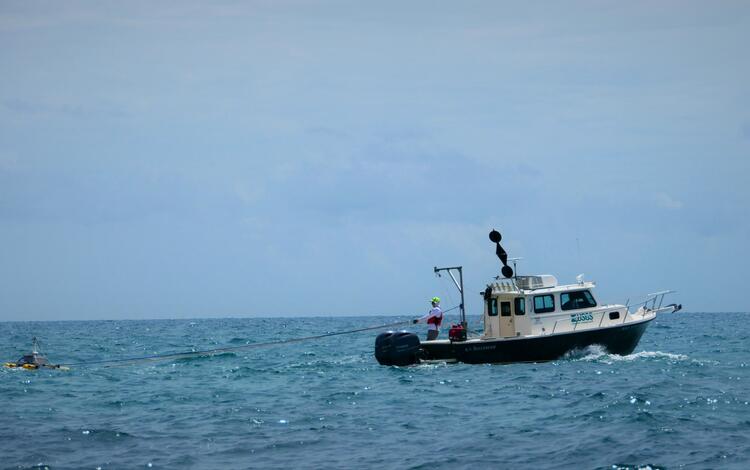
The success of USGS mapping expeditions relies on our team of experts, including marine electronics technicians, engineers, geologists, physical scientists, geographers, and visual and imaging specialists. To map the seafloor surface and its underlying structure in shallow to deep-water environments, they maintain a suite of advanced instruments. These instruments include: multibeam, single-beam, and split beam echo sounders, side-scan-sonar, phase differencing bathymetric sonar, single- and multichannel seismic reflection systems, and sample equipment designed to collect sediment samples, photographs, and videos of the seafloor. They also customize our tools and equipment to expand capabilities and more effectively and efficiently collect geological and geophysical data.
As of January 2025, 54% of the seafloor beneath U.S. waters has been mapped at high-resolution. Thanks to Federal agencies like the USGS, that number will steadily increase each year as we continue to map, characterize, and sample the seafloor, leading to increased safety and prosperity for our Nation.
Related

Seafloor Benthic Mapping and Characterization: Enhancing our Understanding of Aleutian Islands’ Hazards, Potential Seabed Minerals and Deep Corals

California Seafloor Mapping Program

PCMSC Marine Facility (MarFac)

Geologic Mapping of the Massachusetts Seafloor

Sea Floor Mapping Group

National Seafloor Mapping and Benthic Habitat Studies
Related
Seafloor Benthic Mapping and Characterization: Enhancing our Understanding of Aleutian Islands’ Hazards, Potential Seabed Minerals and Deep Corals
California Seafloor Mapping Program
PCMSC Marine Facility (MarFac)
Geologic Mapping of the Massachusetts Seafloor
Sea Floor Mapping Group