
Image of the SeaBOSS and USGS personnel on the fantail of the R/V Connecticut in Long Island Sound
Images
Images related to natural hazards.
Filter Total Items: 7275

SeaBOSS Survey on Long Island Sound
Image of the SeaBOSS and USGS personnel on the fantail of the R/V Connecticut in Long Island Sound

SeaBOSS on the fantail of the R/V Connecticut on Long Island Sound
SeaBOSS on the fantail of the R/V Connecticut on Long Island SoundSeaBOSS on the fantail of the R/V Connecticut on Long Island Sound at sunrise
SeaBOSS on the fantail of the R/V Connecticut on Long Island Sound
SeaBOSS on the fantail of the R/V Connecticut on Long Island SoundSeaBOSS on the fantail of the R/V Connecticut on Long Island Sound at sunrise

SeaBOSS on the fantail of the R/V Connecticut on Long Island Sound
SeaBOSS on the fantail of the R/V Connecticut on Long Island SoundSeaBOSS on the fantail of R/V Connecticut on Long Island Sound
SeaBOSS on the fantail of the R/V Connecticut on Long Island Sound
SeaBOSS on the fantail of the R/V Connecticut on Long Island SoundSeaBOSS on the fantail of R/V Connecticut on Long Island Sound

USGS personnel adjusting equipment on the SeaBOSS
USGS personnel adjust equipment on the SeaBOSS on the fantail of the R/V Connecticut on Long Island Sound
USGS personnel adjust equipment on the SeaBOSS on the fantail of the R/V Connecticut on Long Island Sound

Storm overwash, Surf Drive Beach, Falmouth MA
Storm overwash on Surf Drive Beach, Falmouth, MA
Storm overwash on Surf Drive Beach, Falmouth, MA

Storm overwash, Surf Drive Beach, Falmouth, MA
Storm overwash, Surf Drive Beach, Falmouth, MA
Storm overwash, Surf Drive Beach, Falmouth, MA

Surf Drive Beach, Falmouth, MA
Overwash from Surf Drive Beach, Falmouth, MA

Storm overwash, Surf Drive Beach, Falmouth, MA
Storm overwash, Surf Drive Beach, Falmouth, MA
Storm overwash, Surf Drive Beach, Falmouth, MA

USGS maps identify lava inundation zones for Mauna Loa
USGS maps identify lava inundation zones for Mauna LoaClose up of Sheet 2 of "Lava inundation zone maps for Mauna Loa, Island of Hawai‘i," recently published by the U.S. Geological Survey. Colors depict lava Inundation zones for the Kaumana, Waiākea, and Volcano-Mountain View regions on Mauna Loa. Yellow indicates the volcano's Northeast Rift Zone, one area along which lava could erupt.

Mount Adams viewed from SE.
Mount Adams viewed from the southeast.
Mount Adams viewed from the southeast.

New USGS video about Kīlauea's summit eruption is now online
New USGS video about Kīlauea's summit eruption is now onlineThe lava lake within Halema‘uma‘u, a crater at the summit of Kīlauea, was about 30 m (98 ft) below the vent rim on the day of this photo (January 7, 2016).
New USGS video about Kīlauea's summit eruption is now online
New USGS video about Kīlauea's summit eruption is now onlineThe lava lake within Halema‘uma‘u, a crater at the summit of Kīlauea, was about 30 m (98 ft) below the vent rim on the day of this photo (January 7, 2016).
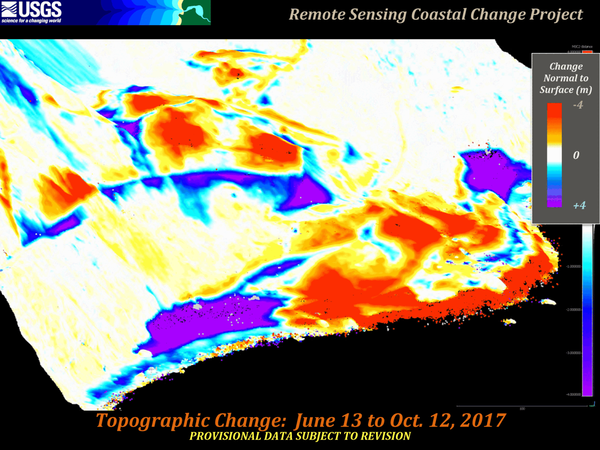
Mud Creek Topo Change June 13-October 12 2017 View 3
Mud Creek Topo Change June 13-October 12 2017 View 3In 2017, the massive Mud Creek landslide buried a quarter-mile of the famous coastal route, California’s Highway 1, with rocks and dirt more than 65 feet deep. USGS monitors erosion along the landslide-prone cliffs of Big Sur, collecting aerial photos frequently throughout the year.

Mud Creek Topo Change June 13-October 12 2017 View 2
Mud Creek Topo Change June 13-October 12 2017 View 2In 2017, the massive Mud Creek landslide buried a quarter-mile of the famous coastal route, California’s Highway 1, with rocks and dirt more than 65 feet deep. USGS monitors erosion along the landslide-prone cliffs of Big Sur, collecting aerial photos frequently throughout the year.

Mud Creek Topo Change June 13-October 12 2017 View 1
Mud Creek Topo Change June 13-October 12 2017 View 1In 2017, the massive Mud Creek landslide buried a quarter-mile of the famous coastal route, California’s Highway 1, with rocks and dirt more than 65 feet deep. USGS monitors erosion along the landslide-prone cliffs of Big Sur, collecting aerial photos frequently throughout the year.

pāhoehoe breakouts on the coastal plain
Scattered breakouts today (October 13) on the western 61g flow margin were mapped at 1.3 km (0.8 mi) from the closest portion of the emergency road. The small pāhoehoe breakouts put on a show as they slowly oozed out of growing cracks that were forced open by flow inflation (pictured).
Scattered breakouts today (October 13) on the western 61g flow margin were mapped at 1.3 km (0.8 mi) from the closest portion of the emergency road. The small pāhoehoe breakouts put on a show as they slowly oozed out of growing cracks that were forced open by flow inflation (pictured).

Map of flow field
This map shows recent changes to Kīlauea's East Rift Zone lava flow field. The area of the active flow field as of September 21 is shown in pink, while widening and advancement of the active flow as of October 12 is shown in red. Older Pu‘u ‘Ō‘ō lava flows (1983-2016) are shown in gray. The yellow line is the trace of the active lava tube.
This map shows recent changes to Kīlauea's East Rift Zone lava flow field. The area of the active flow field as of September 21 is shown in pink, while widening and advancement of the active flow as of October 12 is shown in red. Older Pu‘u ‘Ō‘ō lava flows (1983-2016) are shown in gray. The yellow line is the trace of the active lava tube.

Today (Oct. 12), the Kamokuna lava delta was measured at roughly 11...
Today (Oct. 12), the Kamokuna lava delta was measured at roughly 11...Today (October 12), the Kamokuna lava delta was measured at roughly 11 acres (4.5 hectares) in size. Over the past two months, several lava tube breakouts on the sea cliff have spilled lava onto the delta.

Summer 2017 goes out like a lion with hurricanes and earthquakes: r...
Summer 2017 goes out like a lion with hurricanes and earthquakes: r...Damage to an unreinforced rock wall at KALAHIKIOLA Church in KAP‘A‘āU, North Kohala, on the Island of Hawai‘i, following the magnitude-6.6 Kīholo and magnitude-6.0 Māhukona earthquakes in October 2006. USGS photo by J. Takahashi.

Geologists relocate a time-lapse camera in the Pu‘u ‘Ō‘ō crater.
Geologists relocate a time-lapse camera in the Pu‘u ‘Ō‘ō crater.HVO geologists relocate a time-lapse camera on the rim of the west pit lava pond in the Pu‘u ‘Ō‘ō crater. Over the past several months, the camera has been slowly tilting downward due to soft, altered ground beneath it, and the general instability of the rim. The new location, about 20 m (yards) to the south, appears to be more stable and less altered.

Drone operations on Big Sur landslide, October 12, 2017
Drone operations on Big Sur landslide, October 12, 2017Josh Logan, a physical scientist at the USGS Pacific Coastal and Marine Science Center in Santa Cruz, California, operates an unmanned aerial system, or UAS, often called a "drone", that is equipped with a video camera.

Mud Creek – 3D Point Cloud – Oblique Perspective
Video shot from drones yields details about changing landslide on California’s Big Sur coast
Video shot from drones yields details about changing landslide on California’s Big Sur coast