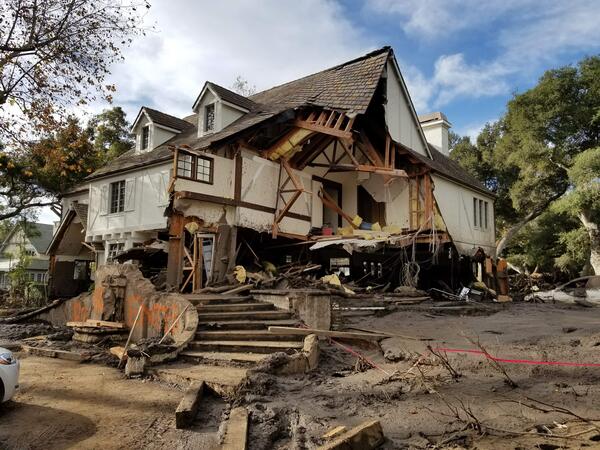
U.S. flag

An official website of the United States government

Images

Images related to natural hazards.

Filter Total Items: 7266
Image of Erika Lentz and Danille Niles at Trunk River Beach, Falmouth, MA
Erika Lentz is interviewed by WBZ Boston for a sea-level rise segment

Erika Lentz, Woods Hole Coastal and Marine Science Center Research Geologist interviewed by WBZ Boston Meterologist, Danielle Niles fora segment on sea-level rise

Erika Lentz interview on Trunk River Beach, Falmouth. MA
Erika Lentz interview by WBZ Meteorologist, Danielle Niles

Research geologist, Erika Lentz, interviewed on Trunk River Beach, Falmouth, MA, by WBZ meterologist, Danielle Niles, about the future impacts of sea-level rise

The Hawaiian Volcano Observatory looks forward to 2018...
The HVO looks forward to 2019

First high-definition thermal image of the Halema‘uma‘u lava lake in the New Year, taken shortly after midnight on January 1, 2018. This camera was deployed to track the dynamic surface activity of the lava lake at the summit of Kīlauea.

First high-definition thermal image of the Halema‘uma‘u lava lake in the New Year, taken shortly after midnight on January 1, 2018. This camera was deployed to track the dynamic surface activity of the lava lake at the summit of Kīlauea.

USGS personnel on the fantail of the R/V Savannah
USGS Team Work!
USGS Team Work!
USGS Team Work!

Sediment transport team members attach a quick-release to the top of a bottom lander prior to deployment

Sediment transport team members attach a quick-release to the top of a bottom lander prior to deployment

 An instrumented bottom lander platform is lowered off the stern of the research vessel
Oceanographic Equipment Deployment
Yellow buoy in the water
Buoy, Buoy
Buoy, Buoy
Buoy, Buoy

The buoy that measures meteorological conditions at the site after deployment.

USGS personnel working with chains on the deck of the R/V Savannah
Assembly of chains, shackles, and links

 Sediment transport team members assemble chain, shackles and pear links that are are attached to the anchor and floats as part of deploying a mooring.

browse graphic of the data locations
Browse graphic of data

Browse graphic of the sediment textuer and geomorphology data of the sea floor from Fenwick Island, MD to FIsherman's Island, VA

Browse graphic of the sediment textuer and geomorphology data of the sea floor from Fenwick Island, MD to FIsherman's Island, VA

Mount Jefferson, Oregon simplified hazards map
Mount Jefferson, OR simplified hazards map

Mount Jefferson, Oregon simplified hazards map showing potential impact area for ground-based hazards during a volcanic event.

Mount Jefferson, Oregon simplified hazards map showing potential impact area for ground-based hazards during a volcanic event.

Samples Repository Collections map interface

Map interface of Cores, grabs, dredges, slides, and other samples, primarily of marine, estuarine, and lacustrine sediments, curated at the USGS Woods Hole Coastal and Marine Science Center.

Map interface of Cores, grabs, dredges, slides, and other samples, primarily of marine, estuarine, and lacustrine sediments, curated at the USGS Woods Hole Coastal and Marine Science Center.

Three panels with bright colors showing underwater bathymetry features
Perspective views of multibeam bathymetry data acquired by the USGS

Perspective views of multibeam bathymetry data acquired by the USGS aboard the R/V Medeia. Shallower depths in red. Arrows point to the distinct line in the seafloor associated with the Queen Charlotte-Fairweather fault.

Photo of a laboratory with various equipment and tables to work on.
PCMSC Marine Minerals Laboratory

A look into the USGS Pacific Coastal and Marine Science Center’s Marine Minerals Laboratory Suite.

quadcopter (drone) and camera ready for launch
Quadcopter's photos can be used to measure dune erosion

The 3DR Solo with GoPro Hero4 camera and gimbal. Coming to a survey area near you soon. Photo credit: Shawn Harrison, USGS. This photo was taken during USGS unmanned aerial systems (drone) pilot training. Two training sessions were held - one in February-March 2017 in Santa Cruz, California and the second in April 2017 in Gainesville, Florida.

The 3DR Solo with GoPro Hero4 camera and gimbal. Coming to a survey area near you soon. Photo credit: Shawn Harrison, USGS. This photo was taken during USGS unmanned aerial systems (drone) pilot training. Two training sessions were held - one in February-March 2017 in Santa Cruz, California and the second in April 2017 in Gainesville, Florida.

Three panels. Left: overhead view of ocean and breakers. Middle and right: Seafloor maps: dark blue deep, light blue shallow.
Estimated and measured bathymetry offshore of Madeira Beach, Florida

Estimated and measured ocean depths (bathymetry) from Madeira Beach, Florida. Each panel shows same geographic area. m = meters. Left: Snapshot transformed from original oblique camera view to overhead “map” view. Middle: Bathymetry estimated by applying cBathy algorithm to July 2017 video imagery. Right: Bathymetry measured with sonar in February 2017.

Estimated and measured ocean depths (bathymetry) from Madeira Beach, Florida. Each panel shows same geographic area. m = meters. Left: Snapshot transformed from original oblique camera view to overhead “map” view. Middle: Bathymetry estimated by applying cBathy algorithm to July 2017 video imagery. Right: Bathymetry measured with sonar in February 2017.

Was this page helpful?