Methane-derived authigenic carbonate (MDAC) rocks on the seafloor
Methane-derived authigenic carbonate (MDAC) rocks on the seafloorMethane-derived authigenic carbonate (MDAC) rocks on the seafloor on the U.S. Atlantic margin

Official websites use .gov
A .gov website belongs to an official government organization in the United States.
Secure .gov websites use HTTPS
A lock () or https:// means you’ve safely connected to the .gov website. Share sensitive information only on official, secure websites.
Images related to natural hazards.

Methane-derived authigenic carbonate (MDAC) rocks on the seafloor on the U.S. Atlantic margin
Methane-derived authigenic carbonate (MDAC) rocks on the seafloor on the U.S. Atlantic margin

Area map of National Seafloor and Habitat Mapping Studies-Atlantic
Area map of National Seafloor and Habitat Mapping Studies-Atlantic

Perspective views of multibeam bathymetry data acquired by the USGS aboard the R/V Medeia. Shallower depths in red. Arrows point to the distinct line in the seafloor associated with the Queen Charlotte-Fairweather fault.
Perspective views of multibeam bathymetry data acquired by the USGS aboard the R/V Medeia. Shallower depths in red. Arrows point to the distinct line in the seafloor associated with the Queen Charlotte-Fairweather fault.

Michael Casso, Woods Hole Coastal and Marine Science Center physical scientist, seeks volunteers from Children’s School of Science students to have their breath measured for carbon dioxide and methane, greenhouse gases USGS scientists measure in the oceans
Michael Casso, Woods Hole Coastal and Marine Science Center physical scientist, seeks volunteers from Children’s School of Science students to have their breath measured for carbon dioxide and methane, greenhouse gases USGS scientists measure in the oceans

Video camera atop a hotel in Madeira Beach, Florida.
Video camera atop a hotel in Madeira Beach, Florida.
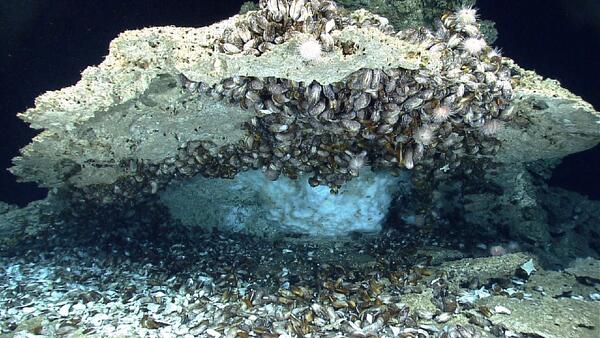
Ice-like gas hydrates under capping rock encrusted with mussels on the sea floor of the northern Gulf of America.
Ice-like gas hydrates under capping rock encrusted with mussels on the sea floor of the northern Gulf of America.

Example of lidar-derived metric products of canopy structure. A) Image showing an area characterized by varied forest strands. (Red box shows from where profile data in E area taken.) B) Lidar-derived maximum canopy height. C) Lidar-derived height of low- to medium-height vegetation beneath the overstory canopy.
Example of lidar-derived metric products of canopy structure. A) Image showing an area characterized by varied forest strands. (Red box shows from where profile data in E area taken.) B) Lidar-derived maximum canopy height. C) Lidar-derived height of low- to medium-height vegetation beneath the overstory canopy.

A profile view from the normalized point cloud in Superior National Forest, notice the flattened ground surface. Points are colored by elevation.
A profile view from the normalized point cloud in Superior National Forest, notice the flattened ground surface. Points are colored by elevation.

Excerpt of satellite image showing landslide impacts to roads, agriculture, and a reservoir in the Lares Municipality. Points identify the approximate location of roads visibly impacted by landslides. Image filename contains approximate latitude and longitude of this impact location.
Excerpt of satellite image showing landslide impacts to roads, agriculture, and a reservoir in the Lares Municipality. Points identify the approximate location of roads visibly impacted by landslides. Image filename contains approximate latitude and longitude of this impact location.

Image of flyer for GeoGirls 2017 science field camp at Mount St. Helens which was held July 30 to August 3, 2017.
Image of flyer for GeoGirls 2017 science field camp at Mount St. Helens which was held July 30 to August 3, 2017.

(Top) Methane plumes at the Norfolk Canyon seeps (~1600 meters or 5250 feet) were detected using the EK60 sonar. The water column plumes are shown above the sub-seafloor structure as imaged by high-resolution multichannel seismic data acquired by the USGS and processed by J. Kluesner.
(Top) Methane plumes at the Norfolk Canyon seeps (~1600 meters or 5250 feet) were detected using the EK60 sonar. The water column plumes are shown above the sub-seafloor structure as imaged by high-resolution multichannel seismic data acquired by the USGS and processed by J. Kluesner.

Map of the general expedition area on the northern U.S. Atlantic Margin between Baltimore Canyon and Cape Hatteras
Map of the general expedition area on the northern U.S. Atlantic Margin between Baltimore Canyon and Cape Hatteras

Map of distribution of fine- and coarse-grained sand, Stellwagen Bank. Blue and purple = boulder ridges. Redlines = leading edges of sand sheets
Map of distribution of fine- and coarse-grained sand, Stellwagen Bank. Blue and purple = boulder ridges. Redlines = leading edges of sand sheets

A look into the USGS Pacific Coastal and Marine Science Center’s Marine Minerals Laboratory Suite.
A look into the USGS Pacific Coastal and Marine Science Center’s Marine Minerals Laboratory Suite.

Overview of the 4 Continuous Bathymetry and Elevation Models of the Massachusetts Coastal Zone and Continental Shelf
Overview of the 4 Continuous Bathymetry and Elevation Models of the Massachusetts Coastal Zone and Continental Shelf

Browse graphic of the sediment textuer and geomorphology data of the sea floor from Fenwick Island, MD to FIsherman's Island, VA
Browse graphic of the sediment textuer and geomorphology data of the sea floor from Fenwick Island, MD to FIsherman's Island, VA

Location map of HARS site

Mount Jefferson, Oregon simplified hazards map showing potential impact area for ground-based hazards during a volcanic event.
Mount Jefferson, Oregon simplified hazards map showing potential impact area for ground-based hazards during a volcanic event.

Graphic showing geophysical and sampling systems used to define the seafloor topography, surface sediments, and underlying geology.
Graphic showing geophysical and sampling systems used to define the seafloor topography, surface sediments, and underlying geology.

Map interface of Cores, grabs, dredges, slides, and other samples, primarily of marine, estuarine, and lacustrine sediments, curated at the USGS Woods Hole Coastal and Marine Science Center.
Map interface of Cores, grabs, dredges, slides, and other samples, primarily of marine, estuarine, and lacustrine sediments, curated at the USGS Woods Hole Coastal and Marine Science Center.

Map showing the location of the Delmarva Peninsula with a hillslope shaded relief map of the study area.
Map showing the location of the Delmarva Peninsula with a hillslope shaded relief map of the study area.