USGS gage 01419500 Willowemoc Creek near Livingston Manor, NY
USGS gage 01419500 Willowemoc Creek near Livingston Manor, NYUSGS gage 01419500 Willowemoc Creek near Livingston Manor, NY

Official websites use .gov
A .gov website belongs to an official government organization in the United States.
Secure .gov websites use HTTPS
A lock () or https:// means you’ve safely connected to the .gov website. Share sensitive information only on official, secure websites.
Explore water-related photography, imagery, and illustrations.

USGS gage 01419500 Willowemoc Creek near Livingston Manor, NY
USGS gage 01419500 Willowemoc Creek near Livingston Manor, NY

Overview of Water Quality in Principal Aquifers


Enhancing scientific research with reproducible, collaborative, and scalable data analysis workflows and methodologies.Example R code leveraging a reproducible data pipeline with the package “remake” to handle dependencies and organize workflow.
Enhancing scientific research with reproducible, collaborative, and scalable data analysis workflows and methodologies.Example R code leveraging a reproducible data pipeline with the package “remake” to handle dependencies and organize workflow.

A U.S. national map with notes about areas of high water use in 2015.
A U.S. national map with notes about areas of high water use in 2015.
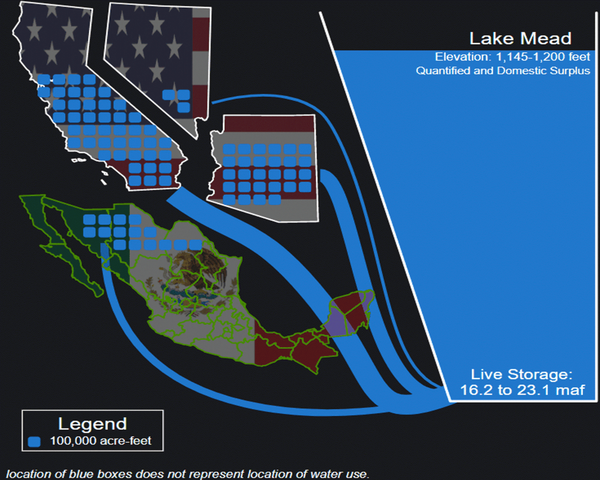
Data Science: Lake Mead Water Level Decline Visualization. Click here to read more about USGS Water Resources Mission Area Data Science.
Data Science: Lake Mead Water Level Decline Visualization. Click here to read more about USGS Water Resources Mission Area Data Science.

The headwaters of the Colorado and Gunnison Rivers was selected in 2019 as an Integrated Water Science Basin.
The headwaters of the Colorado and Gunnison Rivers was selected in 2019 as an Integrated Water Science Basin.

Public Supply Water Use in 2015

Regulation in StreamStats screenshot
Regulation in StreamStats screenshot

Available Precipitation - Average from 1934 to 2002 In Inches Per Year
Available Precipitation - Average from 1934 to 2002 In Inches Per Year

Percentage Change in Population by State and Decade: 1980 - 1990 to 2000 - 2010. For information on confidentiality protection, nonsampling error, and definitions, see http://www.census.gov/prod/cen2010/doc/p194-171.pdf
Percentage Change in Population by State and Decade: 1980 - 1990 to 2000 - 2010. For information on confidentiality protection, nonsampling error, and definitions, see http://www.census.gov/prod/cen2010/doc/p194-171.pdf

Brackish water desalination facility in Harlingen, Texas. The plant was built in 2007 and has a capacity of 2.25 million gallons per day. Source: North Cameron Regional Water Supply Corporation
Brackish water desalination facility in Harlingen, Texas. The plant was built in 2007 and has a capacity of 2.25 million gallons per day. Source: North Cameron Regional Water Supply Corporation
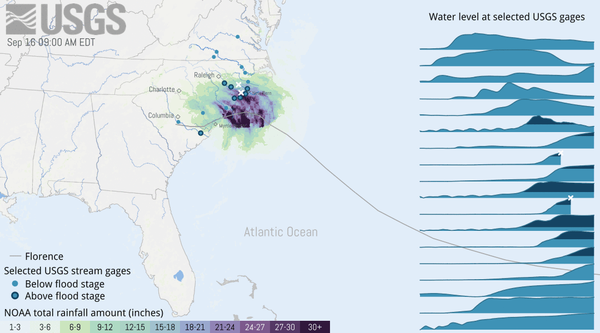
Data visualization pulling together multiple datasets from multiple agencies to explain how rain and flooding from Hurricane Florence impacted the landscape.
Data visualization pulling together multiple datasets from multiple agencies to explain how rain and flooding from Hurricane Florence impacted the landscape.

Industrial water use in 2015

Upstream Network Trace in StreamStats screenshot
Upstream Network Trace in StreamStats screenshot

Salt Deposits (Gypsum). (Source: Siim Sepp, http://www.sandatlas.org/)

Components of a simple water budget for part of a watershed, from Healy, R.W., Winter, T.C., LaBaugh, J.W., and Franke, O.L., 2007, Water budgets: Foundations for effective water-resources and environmental management: U.S. Geological Survey Circular 1308.
Components of a simple water budget for part of a watershed, from Healy, R.W., Winter, T.C., LaBaugh, J.W., and Franke, O.L., 2007, Water budgets: Foundations for effective water-resources and environmental management: U.S. Geological Survey Circular 1308.

Snow falls on USGS Hydrologist, Joe Nawikas, as he collects groundwater samples in Mammoth, California.
Snow falls on USGS Hydrologist, Joe Nawikas, as he collects groundwater samples in Mammoth, California.

Research Hydrologist Paul Hsieh collects seismic data during a groundwater study at Pinnacles National Park in California. The red seismometer on the ground measures ambient seismic noise, which includes microtremors induced by wind, ocean waves, and human activity.
Research Hydrologist Paul Hsieh collects seismic data during a groundwater study at Pinnacles National Park in California. The red seismometer on the ground measures ambient seismic noise, which includes microtremors induced by wind, ocean waves, and human activity.

USGS scientists collect sediment cores to examine the amount and distribution of metals within Lake Powell.
USGS scientists collect sediment cores to examine the amount and distribution of metals within Lake Powell.

Kelvey Merill ADCP measurement at Perdanales River near Fredricksburg - Lynne Fahlquist USGS.
Kelvey Merill ADCP measurement at Perdanales River near Fredricksburg - Lynne Fahlquist USGS.