
Screenshot of raindrop trace in StreamStats
Images
Explore water-related photography, imagery, and illustrations.
Filter Total Items: 2560

Raindrop trace in StreamStats screenshot
Screenshot of raindrop trace in StreamStats

Development of geothermal saline groundwater into a warm-spring spa.
Development of geothermal saline groundwater into a warm-spring spa.Development of geothermal saline groundwater into a warm-spring spa.
(Source: State of Florida Department of Natural Resources. Special Publication No. 21, 1977)
Development of geothermal saline groundwater into a warm-spring spa.
Development of geothermal saline groundwater into a warm-spring spa.Development of geothermal saline groundwater into a warm-spring spa.
(Source: State of Florida Department of Natural Resources. Special Publication No. 21, 1977)

Unlined brine pit on the shore of Skiatook Lake, Okla.
Unlined brine pit on the shore of Skiatook Lake, Okla.Unlined brine pit on the shore of Skiatook Lake, Okla.
(Source: USGS Toxic Substances Hydrology Program)
Unlined brine pit on the shore of Skiatook Lake, Okla.
Unlined brine pit on the shore of Skiatook Lake, Okla.Unlined brine pit on the shore of Skiatook Lake, Okla.
(Source: USGS Toxic Substances Hydrology Program)

Power Generation Plant
Source: U.S. Nuclear Regulatory Commission
Source: U.S. Nuclear Regulatory Commission

Artesian Well, John Pennekamp Coral Reef State Park, Key Largo, FL
Artesian Well, John Pennekamp Coral Reef State Park, Key Largo, FLArtesian Well, John Pennekamp Coral Reef State Park, Key Largo, FL
Artesian Well, John Pennekamp Coral Reef State Park, Key Largo, FL
Artesian Well, John Pennekamp Coral Reef State Park, Key Largo, FLArtesian Well, John Pennekamp Coral Reef State Park, Key Largo, FL

USGS gage 01428000 Tenmile River at Tusten, NY
USGS gage 01428000 Tenmile River at Tusten, NY
USGS gage 01428000 Tenmile River at Tusten, NY

USGS FIM Mapper screenshot.
Figure 1. The USGS FIM Mapper, showing an example flood and hydrograph for Terra Haute, Ind. (Please note, the flood condition displayed represents a higher stream stage than shown in the hydrograph.)
Figure 1. The USGS FIM Mapper, showing an example flood and hydrograph for Terra Haute, Ind. (Please note, the flood condition displayed represents a higher stream stage than shown in the hydrograph.)

Autonomous Underwater Vehicle (AUV) ‘Tethys’
The USGS along with the Monterey Bay Aquarium Research Institute (MBARI) funded a pilot study to use a long-range AUV to study limnology of Lake Michigan. The AUV is pictured here being deployed in Lake Michigan to document variation in algae productivity at a whole-lake scale and compare 3-D spatial patterns in chlorophyll a to satellite estimates.
The USGS along with the Monterey Bay Aquarium Research Institute (MBARI) funded a pilot study to use a long-range AUV to study limnology of Lake Michigan. The AUV is pictured here being deployed in Lake Michigan to document variation in algae productivity at a whole-lake scale and compare 3-D spatial patterns in chlorophyll a to satellite estimates.

Mining water withdrawals in 2015
Mining water withdrawals in 2015

Total water use withdrawals in 2015
Total water use withdrawals in 2015

Trends in population and freshwater withdrawals by source, 1950–2015
Trends in population and freshwater withdrawals by source, 1950–2015Trends in population and freshwater withdrawals by source, 1950–2015
Trends in population and freshwater withdrawals by source, 1950–2015
Trends in population and freshwater withdrawals by source, 1950–2015Trends in population and freshwater withdrawals by source, 1950–2015

Groundwater withdrawals in 2015
Groundwater withdrawals in 2015

Salt Impacted Field
Salt impacted field.
(Source: Colorado State University Extension, Fact Sheet No. 0.521)
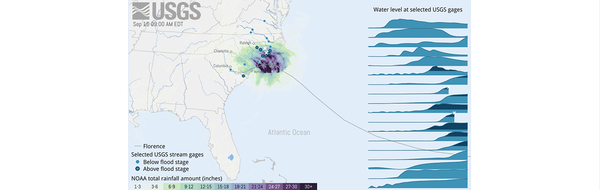
Data Story: Hurricane Florence carousel
Data visualization pulling together multiple datasets from multiple agencies to explain how rain and flooding from Hurricane Florence impacted the landscape.
Data visualization pulling together multiple datasets from multiple agencies to explain how rain and flooding from Hurricane Florence impacted the landscape.

Data Science Tools
Data science tools and techniques to build and execute data workflows for modeling and complex data analyses.
Data science tools and techniques to build and execute data workflows for modeling and complex data analyses.
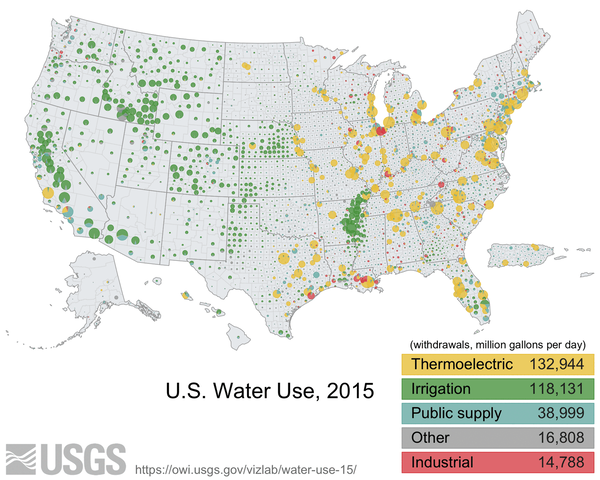
Data Science: Water Use in 2015 Visualization
Data Science: Water Use in 2015 Visualization. Click here to read more about USGS Water Resources Mission Area Data Science.
Data Science: Water Use in 2015 Visualization. Click here to read more about USGS Water Resources Mission Area Data Science.

Domestic Water Use Withdrawals in 2015
Domestic Water Use Withdrawals in 2015

Livestock water withdrawals in 2015
Livestock water withdrawals in 2015

Trends in total water withdrawals by water-use category, 1950–2015
Trends in total water withdrawals by water-use category, 1950–2015Trends in total water withdrawals by water-use category, 1950–2015
Trends in total water withdrawals by water-use category, 1950–2015
Trends in total water withdrawals by water-use category, 1950–2015Trends in total water withdrawals by water-use category, 1950–2015

Artesian Well (cropped), John Pennekamp Coral Reef State Park, Key Lar
Artesian Well (cropped), John Pennekamp Coral Reef State Park, Key LarArtesian Well (cropped), John Pennekamp Coral Reef State Park, Key Largo, FL
Artesian Well (cropped), John Pennekamp Coral Reef State Park, Key Lar
Artesian Well (cropped), John Pennekamp Coral Reef State Park, Key LarArtesian Well (cropped), John Pennekamp Coral Reef State Park, Key Largo, FL
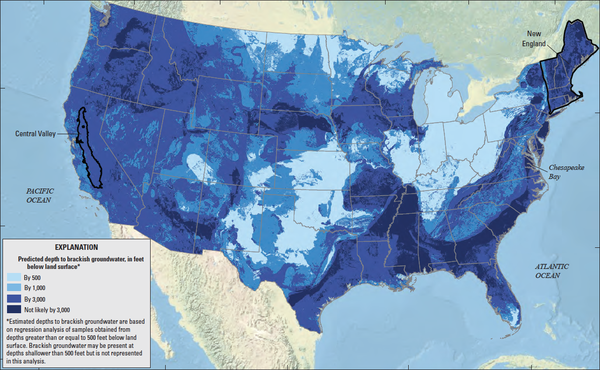
USGS WAUSP Water Census: Map of National Brackish Groundwater Assessme
USGS WAUSP Water Census: Map of National Brackish Groundwater AssessmeUSGS WAUSP Water Census: Map of National Brackish Groundwater Assessment from USGS professional paper 1833 "Brackish Groundwater In The United States."
USGS WAUSP Water Census: Map of National Brackish Groundwater Assessme
USGS WAUSP Water Census: Map of National Brackish Groundwater AssessmeUSGS WAUSP Water Census: Map of National Brackish Groundwater Assessment from USGS professional paper 1833 "Brackish Groundwater In The United States."