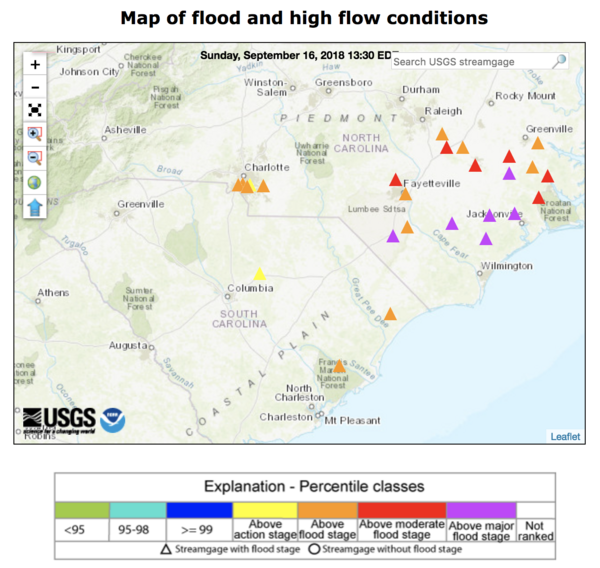
Arial Image of the 2011 Missouri River Flood
Images
Explore water-related photography, imagery, and illustrations.
Arial Image of the 2011 Missouri River Flood
A modern coral reef in Dry Tortugas National Park. There is little living coral and high rates of bioerosion. Photo taken under research permit number DRTO-2018-SCI-0005. Credit: Lauren Toth, USGS
Map of the U.S. by state, showing total water withdrawals, 2015
Map of the U.S. by state, showing total water withdrawals, 2015Map of the U.S. by state, showing total water withdrawals, 2015
Map of the U.S. by state, showing total water withdrawals, 2015
Map of the U.S. by state, showing total water withdrawals, 2015Map of the U.S. by state, showing total water withdrawals, 2015
Real-time flow meter on an Arkansas irrigation well
Real-time flow meter on an Arkansas irrigation wellReal-time flow meter installed on a center-pivot irrigation well in Mississippi County, Arkansas as part of a cooperative project conducted between USGS and the Arkansas Natural Resources Commission. The meter will measure water use for irrigation, providing data which will help improve water-use information in other locations as well.
High water mark sign at Yellowstone River at Carters Bridge
High water mark sign at Yellowstone River at Carters BridgeHigh water mark sign at Yellowstone River at Carters Bridge
High water mark sign at Yellowstone River at Carters Bridge
High water mark sign at Yellowstone River at Carters BridgeHigh water mark sign at Yellowstone River at Carters Bridge
Peak-flow measurement at Flathead River at Flathead, British Columbia
Peak-flow measurement at Flathead River at Flathead, British ColumbiaPeak-flow measurement at Flathead River at Flathead, British Columbia
Peak-flow measurement at Flathead River at Flathead, British Columbia
Peak-flow measurement at Flathead River at Flathead, British ColumbiaPeak-flow measurement at Flathead River at Flathead, British Columbia
Flooding in Soldier Pond, Maine, following rainfall and snowmelt that led to high water levels in the Fish and St. John Rivers in April and May of 2018.
USGS field crews installed a temporary rapid deployment gage on May 2, 2018, at Soldier Pond in the Fish River to monitor flooding near Fort Kent in Maine.
Screenshot of ModelMuse displaying WellFootprint results. The following words are displayed "We will contour the mesh... or in this case, the grid, I should say. So that's what it looks like."
Changes in Earth's Gravity Reveal Changes in Groundwater Storage
Changes in Earth's Gravity Reveal Changes in Groundwater StorageDid you know that changes in the amount of water in aquifers cause small changes in Earth’s gravitational field? When the amount of groundwater in an aquifer changes, either by recharge or by discharge to surface water or wells, the gravitational acceleration at the land surface also changes.
Streamflow measurement at Milk River near Harlem, Montana
Streamflow measurement at Milk River near Harlem, MontanaStreamflow measurement at Milk River near Harlem, Montana
Streamflow measurement at Milk River near Harlem, Montana
Streamflow measurement at Milk River near Harlem, MontanaStreamflow measurement at Milk River near Harlem, Montana
Reston stable isotope lab (RSIL): reference powder
Reston stable isotope lab (RSIL): reference powderReston stable isotope lab RSIL Reference Powder
Reston stable isotope lab (RSIL): reference powder
Reston stable isotope lab (RSIL): reference powderReston stable isotope lab RSIL Reference Powder
Photo of silver capsules containing reference water used for the calibration of stable hydrogen and oxygen measurements. This reference material is intended for calibration of stable hydrogen (δ2H) and oxygen (δ18O) measurements of unknown water or hydrogen- or oxygen-bearing substances with a TC/EA (thermal conversion/elemental analyzer)
Reston stable isotope lab RSIL Reference Oil
Reston stable isotope lab RSIL Reference Hair
Photo of glass ampoules of reference material VSMOW. This reference material (RM) is an international measurement standard that defines the zero of the δ2 H and δ18O Vienna Standard Mean Ocean Water–Standard Light Antarctic Precipitation (VSMOW-SLAP) isotope scales in water and in all other hydrogen-bearing substances and in selected oxyge
USGS Streamgage 14315950 FISH CREEK ABV SLIPPER CREEK NR TOKETEE FALL
USGS Streamgage 14315950 FISH CREEK ABV SLIPPER CREEK NR TOKETEE FALLUSGS Stream Gage 14315950 FISH CREEK ABV SLIPPER CREEK NR TOKETEE FALLS, OR .
Station operated in cooperation with PacifiCorp.
Dead Run is a typical urban creek in the Baltimore area (photo 1)
Dead Run is a typical urban creek in the Baltimore area (photo 1)Dead Run is an urban creek in Catonsville, Maryland, near Baltimore. Research has found that about half of the bed sediment originates as particulate matter on pavement that then is washed into the creek via storm drains.
Dead Run is a typical urban creek in the Baltimore area (Photo 3)
Dead Run is a typical urban creek in the Baltimore area (Photo 3)Dead Run is an urban creek in Catonsville, Maryland, near Baltimore. Research has found that about half of the bed sediment originates as particulate matter on pavement that then is washed into the creek via storm drains.