
Floods are the leading cause of natural-disaster losses in the U.S. The USGS Flood Inundation Mapping (FIM) Program helps communities protect lives and property by providing tools and information to help them understand their local flood risks and make cost-effective mitigation decisions.
USGS Flood Inundation Mapper
USGS Flood Information
When planning for a flood, there are three key questions that must be answered: What areas will be flooded? How deep will the floodwaters get? When will the flood arrive? A flood inundation map library is a set of maps that together show where flooding may occur – and how deep it may be - over a range of potential flooding scenarios in a stream or river.
Historical flooding can help a community anticipate how much impact similar flood events could have, but there are modern modeling methods and tools that can provide more accurate and nuanced estimations of a wide variety of flood conditions. The USGS Flood Inundation Mapping (FIM) Program helps communities pair a flood inundation map library with USGS real-time streamgage data and National Weather Service flood forecasts to form a two-dimensional flood warning system. Together, these products can help communities estimate the extent of the flood and identify at-risk areas and resources in advance of the floodwaters arriving, providing a powerful advantage in the effort to keep people and property safe from rising waters.
Monitoring a flood
What areas will be flooded?
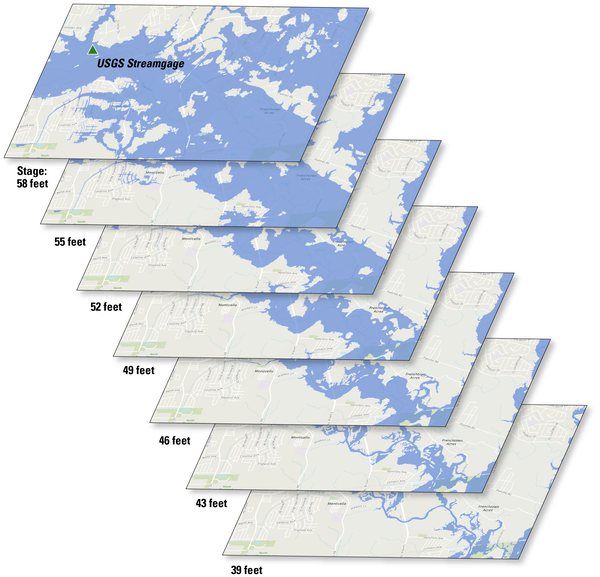
A flood inundation map library is a set of maps that show the spatial extent and depth of flooding at specific water-level (stream stage) intervals along an individual stream section. For example, one inundation map might be produced at every foot of stream stage along a typical flood hydrograph. These maps are created using hydraulic and topographic modeling and can more accurately visualize a wider range of flooding scenarios than relying on past experiences alone.
Media
Sources/Usage: Public Domain. View Media Details
How deep will the flood waters get?
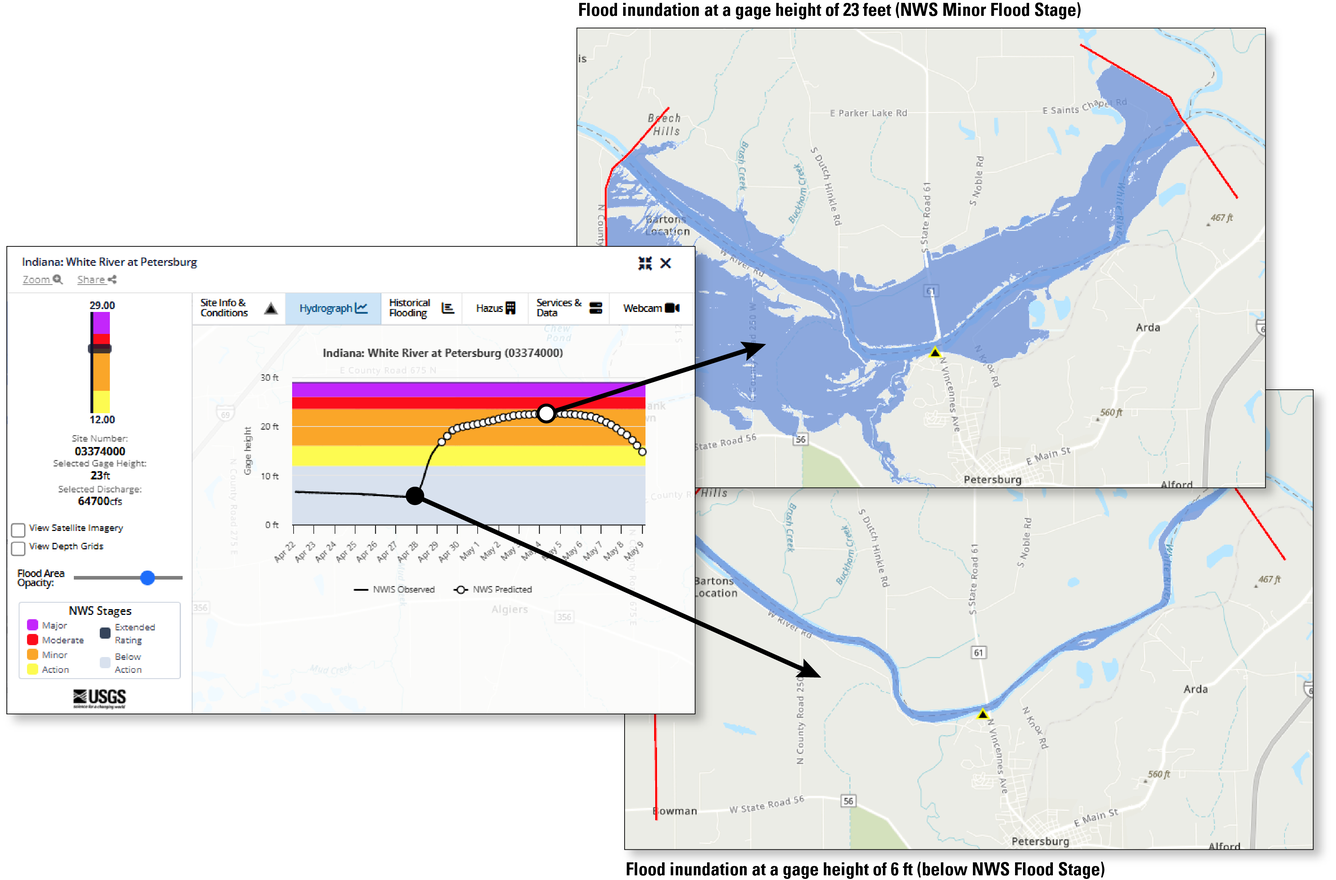
The USGS operates a network of streamgages that provide real-time information about water levels throughout the U.S. - they measure how high the water is right now. By combining USGS real-time data with flood inundation map libraries, communities can better envision what changing water levels will mean. For example, we can convert an arbitrary statement like “flood stage of 12 feet” into a meaningful map that shows the community where flooding is likely to occur.
When will the flood waters arrive?
The National Weather Service provides flood forecasts at roughly half of all USGS streamgages - they predict how high the water will be in the near future. These forecasts are developed with local hydrologic models and typically provide forecasts up to several days before the flood impacts the area.
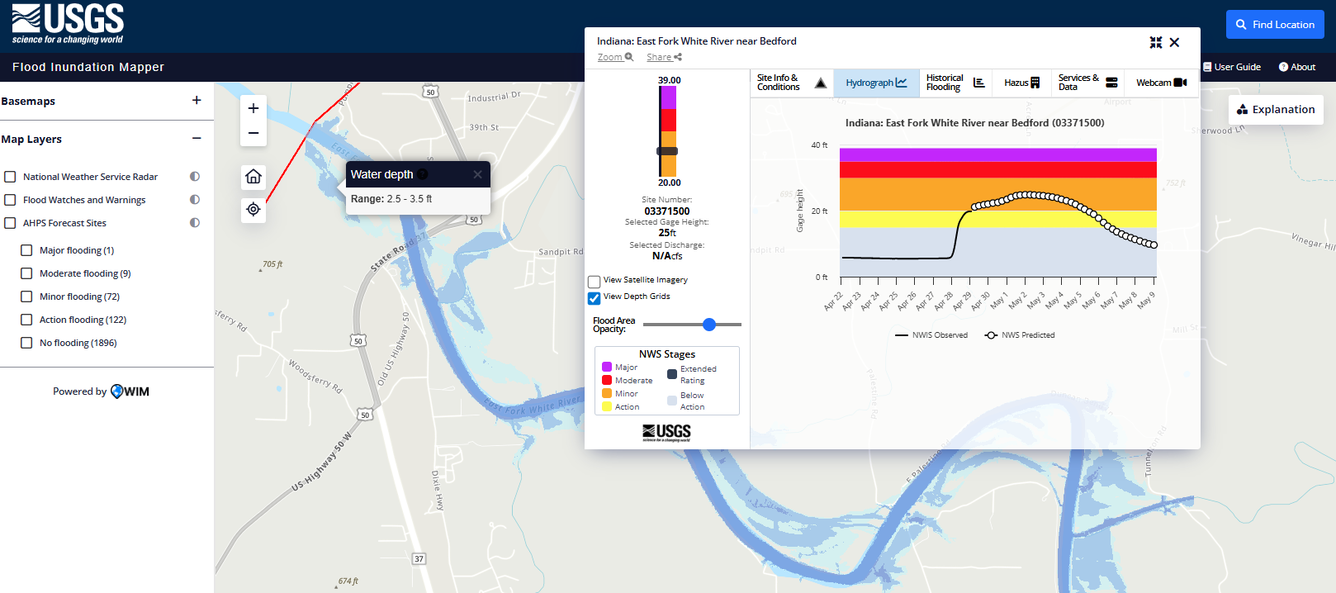
By producing a flood inundation map library that estimates flooding at a variety of water levels, and coupling that library with real-time data and flood forecasts, communities can identify areas that are at risk for flooding, plan for future floods, and take action before people and property are at risk. The USGS Flood Inundation Mapper, an online mapping application, allows communities to interactively view their inundation maps (and loss estimations, if available) and visualize the spatial dimension of potential floods.
Media
Sources/Usage: Public Domain. View Media Details
How Do We Make A Flood Inundation Map Library?
Step 1: Stream selection
The best locations for flood inundation map libraries are streams or rivers located in a populated community where flooding could affect critical infrastructure (bridges, utilities, or hazardous materials) or important human resources (hospitals, shelters, and densely populated areas). Ideally, the chosen reach will be near an existing USGS streamgage, but a gage can be installed if needed. If the community is also interested in real-time flood monitoring and response activities, the streamgage should also be a National Weather Service (NWS) forecast location.
Step 2: Modeling flood heights
Media
Sources/Usage: Public Domain. View Media Details
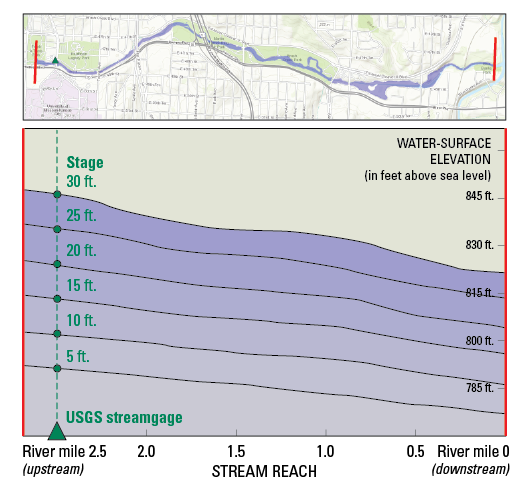
Once a stream reach is identified, a carefully calibrated hydraulic model estimates the height of a flood along the reach at a specific stream stage (water level). The model is run multiple times at incremental stream stages from near-bankfull to historical record flood levels, producing a series of water-surface profiles that define flood heights throughout the reach.
Media
Sources/Usage: Public Domain. View Media Details
Step 3: Delineating the extent of flood inundation
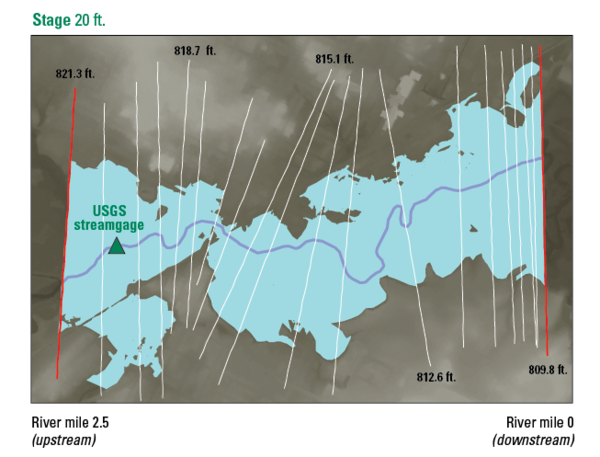
After the hydraulic model identifies the incremental flooding heights, that data are combined with a very detailed ground-surface elevation model (a lidar-based Digital Elevation Model). This process creates a spatial grid showing where flooding would occur. These grids define the probable areas of floodwater inundation and are the first pieces of a flood inundation map.
Media
Sources/Usage: Public Domain. View Media Details
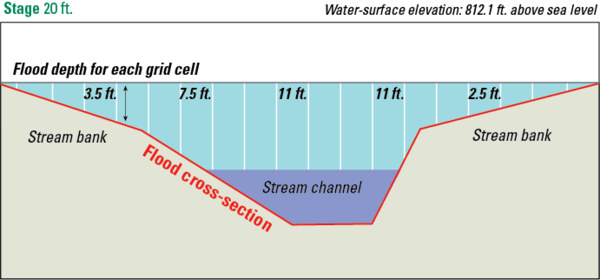
Step 4: Computing depths of flood inundation
The next step is to model how deep the flooding would be for each grid cell in the inundation area by subtracting the ground-surface elevation from the modeled flood surface elevation.
Media
Sources/Usage: Public Domain. View Media Details
Step 5: Building the full map library
Once the model is complete, surface and inundation extents and depth grids are calculated for multiple flood levels along the reach. Each iteration produces a single flood inundation map, and together they provide a full picture of the flooding scenario of how far and how deep the floodwaters could reach. Each library’s modeling and development process is documented and reviewed by other flood scientists to ensure the modeling was done correctly and produced valid results.
Step 6: Publishing the map library on the USGS FIM Mapper
The last step is to upload the flood inundation map library to the USGS Flood Inundation Mapper, where the flood extents and depths can be seen in context with local maps. This helps communities visualize, plan, and respond to floods.
Related flood inundation mapping science.
Flood Inundation Mapping (FIM) Program
The USGS Flood Inundation Mapping (FIM) Program helps communities protect lives and property by providing tools and information to help them understand their local flood risks and make cost-effective mitigation decisions.

USGS Flood Information
The USGS collects flood data and conducts targeted flood science to help Federal, State, and local agencies, decision makers, and the public before, during, and after a flood. Our efforts provide situational awareness, drive predictive models, inform infrastructure design and operation, undergird floodplain mapping, assist flood constituent/load quantification, and facilitate flood impact...
Multimedia items associated with flood inundation mapping science.

Flood inundation
Floods are the leading cause of natural-disaster losses in the U.S. The USGS Flood Inundation Mapping (FIM) Program helps communities protect lives and property by providing tools and information to help them understand their local flood risks and make cost-effective mitigation decisions.
When planning for a flood, there are three key questions that must be answered: What areas will be flooded? How deep will the floodwaters get? When will the flood arrive? A flood inundation map library is a set of maps that together show where flooding may occur – and how deep it may be - over a range of potential flooding scenarios in a stream or river.
Historical flooding can help a community anticipate how much impact similar flood events could have, but there are modern modeling methods and tools that can provide more accurate and nuanced estimations of a wide variety of flood conditions. The USGS Flood Inundation Mapping (FIM) Program helps communities pair a flood inundation map library with USGS real-time streamgage data and National Weather Service flood forecasts to form a two-dimensional flood warning system. Together, these products can help communities estimate the extent of the flood and identify at-risk areas and resources in advance of the floodwaters arriving, providing a powerful advantage in the effort to keep people and property safe from rising waters.
Monitoring a flood
What areas will be flooded?
A flood inundation map library is a set of maps that show the spatial extent and depth of flooding at specific water-level (stream stage) intervals along an individual stream section. For example, one inundation map might be produced at every foot of stream stage along a typical flood hydrograph. These maps are created using hydraulic and topographic modeling and can more accurately visualize a wider range of flooding scenarios than relying on past experiences alone.
Media
Sources/Usage: Public Domain. View Media Details
How deep will the flood waters get?
The USGS operates a network of streamgages that provide real-time information about water levels throughout the U.S. - they measure how high the water is right now. By combining USGS real-time data with flood inundation map libraries, communities can better envision what changing water levels will mean. For example, we can convert an arbitrary statement like “flood stage of 12 feet” into a meaningful map that shows the community where flooding is likely to occur.
When will the flood waters arrive?
The National Weather Service provides flood forecasts at roughly half of all USGS streamgages - they predict how high the water will be in the near future. These forecasts are developed with local hydrologic models and typically provide forecasts up to several days before the flood impacts the area.
By producing a flood inundation map library that estimates flooding at a variety of water levels, and coupling that library with real-time data and flood forecasts, communities can identify areas that are at risk for flooding, plan for future floods, and take action before people and property are at risk. The USGS Flood Inundation Mapper, an online mapping application, allows communities to interactively view their inundation maps (and loss estimations, if available) and visualize the spatial dimension of potential floods.
Media
Sources/Usage: Public Domain. View Media Details
How Do We Make A Flood Inundation Map Library?
Step 1: Stream selection
The best locations for flood inundation map libraries are streams or rivers located in a populated community where flooding could affect critical infrastructure (bridges, utilities, or hazardous materials) or important human resources (hospitals, shelters, and densely populated areas). Ideally, the chosen reach will be near an existing USGS streamgage, but a gage can be installed if needed. If the community is also interested in real-time flood monitoring and response activities, the streamgage should also be a National Weather Service (NWS) forecast location.
Step 2: Modeling flood heights
Media
Sources/Usage: Public Domain. View Media Details
Once a stream reach is identified, a carefully calibrated hydraulic model estimates the height of a flood along the reach at a specific stream stage (water level). The model is run multiple times at incremental stream stages from near-bankfull to historical record flood levels, producing a series of water-surface profiles that define flood heights throughout the reach.
Media
Sources/Usage: Public Domain. View Media Details
Step 3: Delineating the extent of flood inundation
After the hydraulic model identifies the incremental flooding heights, that data are combined with a very detailed ground-surface elevation model (a lidar-based Digital Elevation Model). This process creates a spatial grid showing where flooding would occur. These grids define the probable areas of floodwater inundation and are the first pieces of a flood inundation map.
Media
Sources/Usage: Public Domain. View Media Details
Step 4: Computing depths of flood inundation
The next step is to model how deep the flooding would be for each grid cell in the inundation area by subtracting the ground-surface elevation from the modeled flood surface elevation.
Media
Sources/Usage: Public Domain. View Media Details
Step 5: Building the full map library
Once the model is complete, surface and inundation extents and depth grids are calculated for multiple flood levels along the reach. Each iteration produces a single flood inundation map, and together they provide a full picture of the flooding scenario of how far and how deep the floodwaters could reach. Each library’s modeling and development process is documented and reviewed by other flood scientists to ensure the modeling was done correctly and produced valid results.
Step 6: Publishing the map library on the USGS FIM Mapper
The last step is to upload the flood inundation map library to the USGS Flood Inundation Mapper, where the flood extents and depths can be seen in context with local maps. This helps communities visualize, plan, and respond to floods.
Related flood inundation mapping science.
Flood Inundation Mapping (FIM) Program
The USGS Flood Inundation Mapping (FIM) Program helps communities protect lives and property by providing tools and information to help them understand their local flood risks and make cost-effective mitigation decisions.
USGS Flood Information
The USGS collects flood data and conducts targeted flood science to help Federal, State, and local agencies, decision makers, and the public before, during, and after a flood. Our efforts provide situational awareness, drive predictive models, inform infrastructure design and operation, undergird floodplain mapping, assist flood constituent/load quantification, and facilitate flood impact...
Multimedia items associated with flood inundation mapping science.
Flood inundation
Floods are the leading cause of natural-disaster losses in the U.S. The USGS Flood Inundation Mapping (FIM) Program helps communities protect lives and property by providing tools and information to help them understand their local flood risks and make cost-effective mitigation decisions.
Floods are the leading cause of natural-disaster losses in the U.S. The USGS Flood Inundation Mapping (FIM) Program helps communities protect lives and property by providing tools and information to help them understand their local flood risks and make cost-effective mitigation decisions.