
New version of USGS Flood Inundation Mapper!
New FIM mapper is mobile-friendly and contains new features
The science behind flood inundation mapping
USGS Flood Information
The USGS Flood Inundation Mapping (FIM) Program helps communities protect lives and property by providing tools and information to help them understand their local flood risks and make cost-effective mitigation decisions.
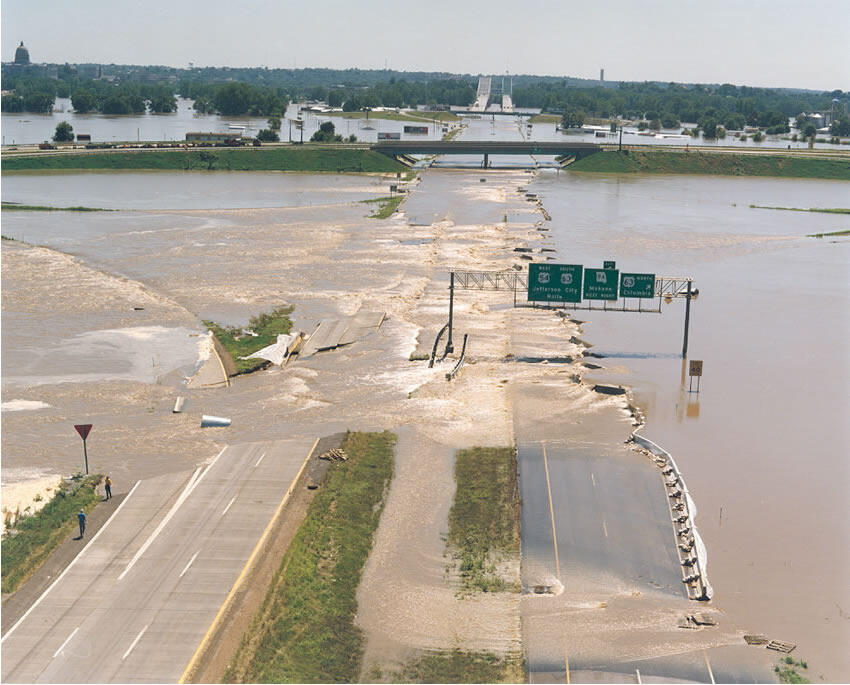
Floods are the leading cause of natural-disaster losses in the U.S. More than 75 percent of declared Federal disasters are related to floods, and annual flood losses average almost \$46 billion per year (in 2023 dollars). That damage is projected to be a quarter to a third greater in 2050 because of increases in flood risk due to climate change. Although the number of fatalities has declined due to improved early warning systems, economic losses continue to rise with increased urbanization in flood-hazard areas.
A flood inundation map library is a set of maps that shows where flooding may occur – and how deep it may be - over a range of potential water levels of a stream or river. Communities use inundation maps for:
- Preparedness - "What-if" scenarios
- Timely response - tied to real-time streamgage and forecast information
- Recovery - damage assessment
- Mitigation and planning - flood risk analyses
- Environmental and ecological assessments - wetlands identification, hazardous spill clean up
The USGS Flood Inundation Mapping (FIM) Program has two main functions:
1) Partner with local communities to assist with the development and validation of flood inundation map libraries at USGS streamgage locations.
The USGS works with communities to identify an appropriate stream section, gather the necessary data to model where flooding will likely occur, and verify that the maps produced are scientifically sound.
2) Provide online access to flood inundation maps along with real-time streamgage data, flood forecasts, and potential loss estimates.
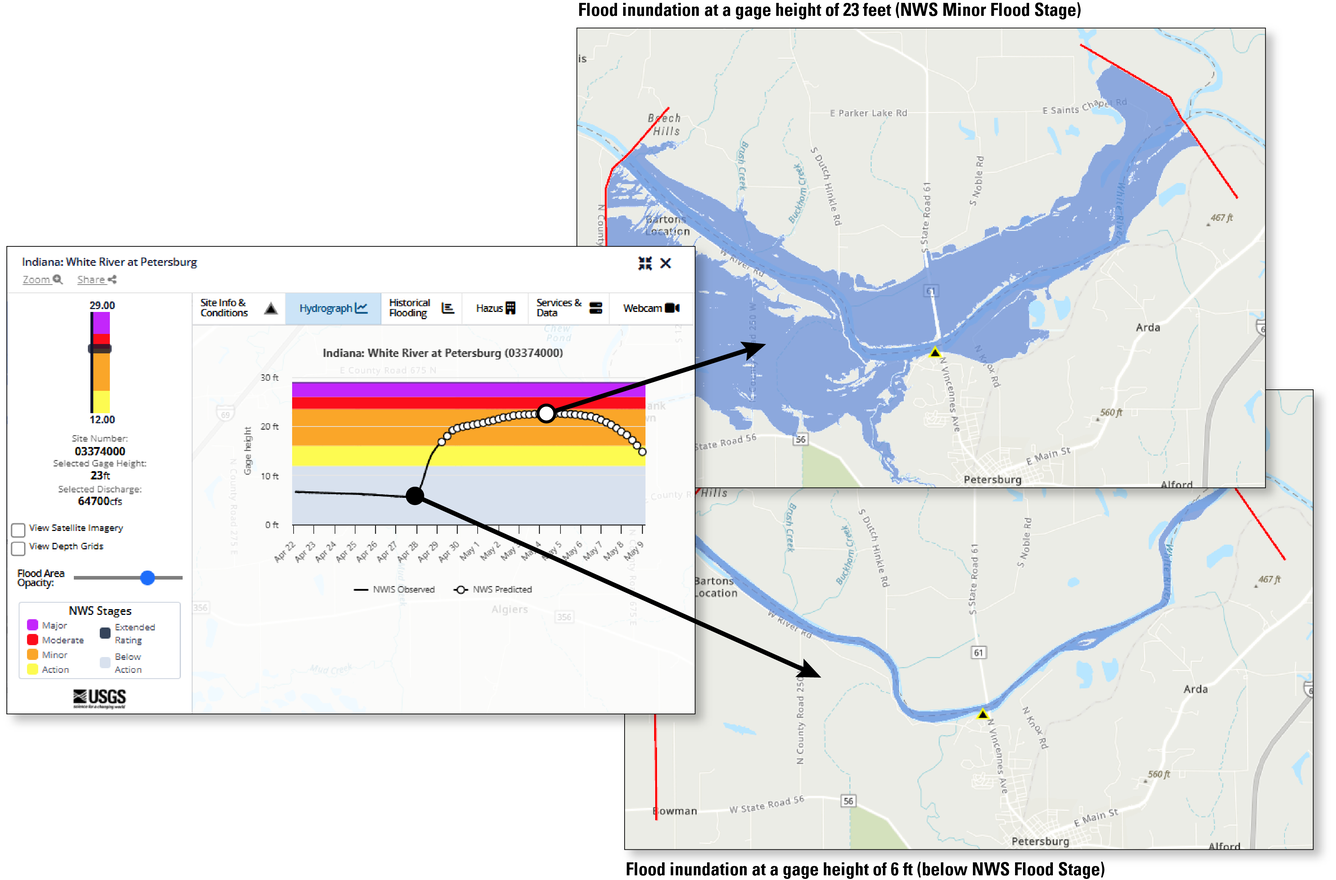
Once a community’s map library is complete, it is uploaded to the USGS Flood Inundation Mapper, an online public mapping application. The FIM Mapper allows users to explore the full set of inundation maps that together show where flooding would occur given a selected stream condition. Users can also access historical flood information and potential loss estimates based on the severity of the flood. The FIM Mapper helps communities visualize potential flooding scenarios, identify areas and resources that may be at risk, and enhance their local response effort during a flooding event.
The USGS works with the National Weather Service, the U.S. Army Corps of Engineers, and the Federal Emergency Management Agency to connect communities with federal flood-related science to ensure the quality and consistency of flood inundation maps across the country.


Related flood inundation mapping information.

USGS Flood Information
Flood Inundation Mapping Science
The USGS Flood Inundation Mapping (FIM) Program helps communities protect lives and property by providing tools and information to help them understand their local flood risks and make cost-effective mitigation decisions.
Floods are the leading cause of natural-disaster losses in the U.S. More than 75 percent of declared Federal disasters are related to floods, and annual flood losses average almost \$46 billion per year (in 2023 dollars). That damage is projected to be a quarter to a third greater in 2050 because of increases in flood risk due to climate change. Although the number of fatalities has declined due to improved early warning systems, economic losses continue to rise with increased urbanization in flood-hazard areas.
A flood inundation map library is a set of maps that shows where flooding may occur – and how deep it may be - over a range of potential water levels of a stream or river. Communities use inundation maps for:
- Preparedness - "What-if" scenarios
- Timely response - tied to real-time streamgage and forecast information
- Recovery - damage assessment
- Mitigation and planning - flood risk analyses
- Environmental and ecological assessments - wetlands identification, hazardous spill clean up
The USGS Flood Inundation Mapping (FIM) Program has two main functions:
1) Partner with local communities to assist with the development and validation of flood inundation map libraries at USGS streamgage locations.
The USGS works with communities to identify an appropriate stream section, gather the necessary data to model where flooding will likely occur, and verify that the maps produced are scientifically sound.
2) Provide online access to flood inundation maps along with real-time streamgage data, flood forecasts, and potential loss estimates.
Once a community’s map library is complete, it is uploaded to the USGS Flood Inundation Mapper, an online public mapping application. The FIM Mapper allows users to explore the full set of inundation maps that together show where flooding would occur given a selected stream condition. Users can also access historical flood information and potential loss estimates based on the severity of the flood. The FIM Mapper helps communities visualize potential flooding scenarios, identify areas and resources that may be at risk, and enhance their local response effort during a flooding event.
The USGS works with the National Weather Service, the U.S. Army Corps of Engineers, and the Federal Emergency Management Agency to connect communities with federal flood-related science to ensure the quality and consistency of flood inundation maps across the country.
Related flood inundation mapping information.
USGS Flood Information