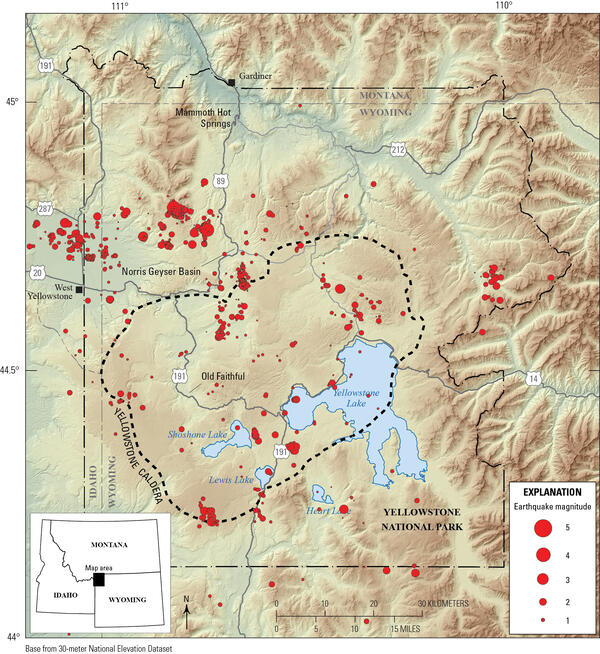
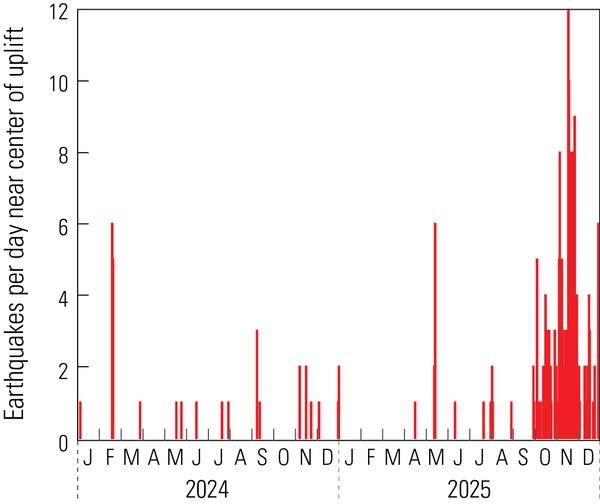
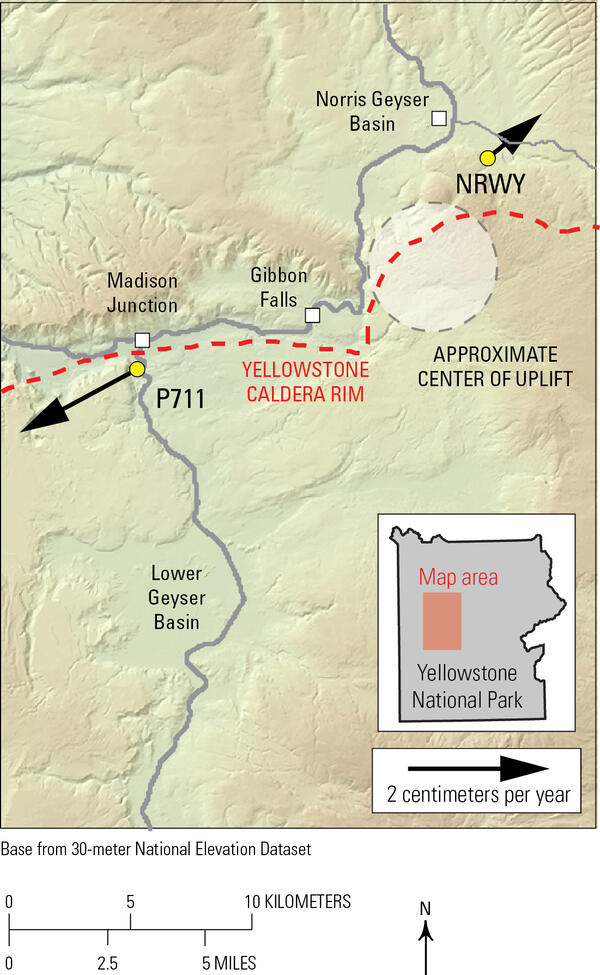
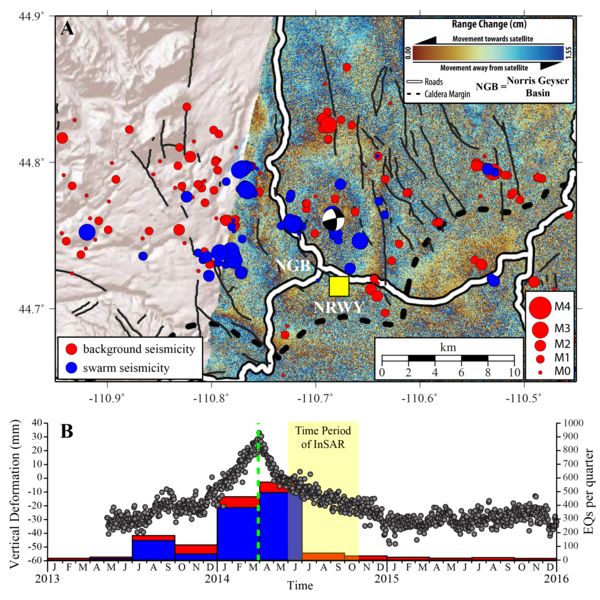
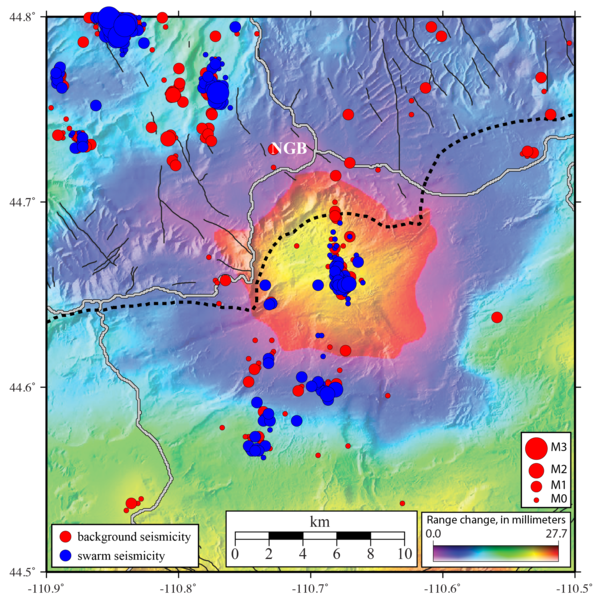
U.S. flag

An official website of the United States government

Images

Images related to Yellowstone Volcano Observatory.

Filter Total Items: 706
Map of Yellowstone region with triangles, most of which indicate stations used to calculate AI magnitudes
Map of Yellowstone Seismic Network showing stations used to calculate earthquake magnitudes using various methods

A map of the stations operating in the Yellowstone region between 2012 and 2024 shown as triangles with fill and edge colors indicating whether they are used to calculate magnitudes using traditional approaches, artificial intelligence methods, or both.

Map view and time series plots of deformation in the Yellowstone area
Ground deformation in the Yellowstone area from GPS viewed in a reference frame where North American plate motion has been removed
Plots of ground deformation showing the impacts of reference frame (e.g., point of view)
GPS station velocities in the western USA shown in global and North American reference frames

GPS station velocities in the western USA shown in a global (left) and North American (right) reference frame. The direction and length of each arrow shows where that station is moving over time, and how fast. The global reference frame shows overall motion of the North American plate.

GPS station velocities in the western USA shown in a global (left) and North American (right) reference frame. The direction and length of each arrow shows where that station is moving over time, and how fast. The global reference frame shows overall motion of the North American plate.

A young man and young woman examine a tan-colored rock outcrop with some grasses and a small tree
Montana State University researchers recording data at an outcrop in Yellowstone National Park

Montana State University researchers recording data at an outcrop in Yellowstone National Park. M.S. student Liv Wheeler (right) overlays the GPS position of the outcrop over a geologic map produced by USGS geologist Robert Christianson, while undergraduate student Liam Arnold (left) notes other data related to the outcrop.

Montana State University researchers recording data at an outcrop in Yellowstone National Park. M.S. student Liv Wheeler (right) overlays the GPS position of the outcrop over a geologic map produced by USGS geologist Robert Christianson, while undergraduate student Liam Arnold (left) notes other data related to the outcrop.

Database entry at top, photo of field book and gray rock in middle, and topographic map with locations noted at bottom
Geodatabase entry for a sample of the Lava Creek Tuff

Geodatabase entry for a sample of the Lava Creek Tuff, which is a result of the eruption that formed Yellowstone Caldera about 631,000 years ago.  Top: A selected point in the ArcGIS geodatabase showing all the data recorded in the field as well as an image of the rock sample. Bottom: Topographic map showing the location of where the data were recorded.

Geodatabase entry for a sample of the Lava Creek Tuff, which is a result of the eruption that formed Yellowstone Caldera about 631,000 years ago.  Top: A selected point in the ArcGIS geodatabase showing all the data recorded in the field as well as an image of the rock sample. Bottom: Topographic map showing the location of where the data were recorded.

Mountainside with a tree-covered landslide scar in the background, a treed slope in the foreground, and partly cloudy skies
Gros Ventre landslide area in 2025

Photograph of the Gros Ventre Slide 100 years after it occurred. View is to the south, with the landslide scar visible in the middle of the treed hillslope across the valley. Lower Slide Lake, which formed behind the landslide debris, is visible on the left side of the photograph.  Photo by James Mauch, Wyoming State Geological Survey, June 7, 2025.

Photograph of the Gros Ventre Slide 100 years after it occurred. View is to the south, with the landslide scar visible in the middle of the treed hillslope across the valley. Lower Slide Lake, which formed behind the landslide debris, is visible on the left side of the photograph.  Photo by James Mauch, Wyoming State Geological Survey, June 7, 2025.

shaded relief map with topography indicating landslide scars along mountains that border a river valley
Oblique lidar shaded relief image of the Gros Ventre Slide, Wyoming

Oblique lidar shaded relief map looking east up the Gros Ventre River valley, Wyoming. The Gros Ventre Slide, which occurred on June 23, 1925, is outlined in black, and it moved from the high ridge on the south (right side of image) into the valley below. North-dipping sedimentary rock units are labeled in white, separated by white dashed lines.

Oblique lidar shaded relief map looking east up the Gros Ventre River valley, Wyoming. The Gros Ventre Slide, which occurred on June 23, 1925, is outlined in black, and it moved from the high ridge on the south (right side of image) into the valley below. North-dipping sedimentary rock units are labeled in white, separated by white dashed lines.

map with shaded relief in grayscale, and water (ponds, streams, and springs) in blue
Shaded relief map of Norris Geyser Basin indicating new hydrothermal feature near "Tree Island"

Lidar shaded relief map of the Porcelain Basin and Back Basin areas of Norris Geyser Basin in Yellowstone National Park.  Orange star indicates the location of a new thermal pool that formed sometime during late December 2024 to early February 2025.

animated gif of satellite images showing development of a small hydrothermal pool between October 2024 and February 2025
Animated GIF of the development of a new hydrothermal feature during late 2024 to early 2024, Norris Geyser Basin, Yellowstone National Park

Animated GIF of high-resolution satellite images of the Porcelain Basin area of Norris Geyser Basin, Yellowstone National Park, showing the development of a new thermal pool in the circled area.  There is no indication of the pool in images from October 19 and December 19, 2024.  A small depression is visible in the January 6, 2025, image.  In the Feb

Satellite images that depict lessening snow over time in the Yellowstone region during May to June 2025
Landsat images of snow cover in Yellowstone during May-June 2025

Landsat 8 and 9 images of southwest Yellowstone National Park from 9-May (left), 25-May (center), and 18-June (right), 2025. The red labels are for the Madison (MP) and Pitchstone Plateaus (PP). The Yellow labels are for Shoshone (SL), Lewis (LL), Heart Lake, and Yellowstone (YL) Lakes. The Blue labels are for Lower (LGB) and Upper (UGB) Geyser Basins.

Landsat 8 and 9 images of southwest Yellowstone National Park from 9-May (left), 25-May (center), and 18-June (right), 2025. The red labels are for the Madison (MP) and Pitchstone Plateaus (PP). The Yellow labels are for Shoshone (SL), Lewis (LL), Heart Lake, and Yellowstone (YL) Lakes. The Blue labels are for Lower (LGB) and Upper (UGB) Geyser Basins.

At sunset a small plume of muddy water erupts from an otherwise placid, steaming pool surrounded by barren rocky ground
Eruption from Black Diamond Pool in Biscuit Basin, Yellowstone National Park, captured by a webcam on May 31, 2025

This frame capture of a video from a webcam shows a small eruption emanating from Black Diamond Pool in Biscuit Basin, a subbasin of Upper Geyser Basin in Yellowstone National Park, on May 31, 2025.  This was the site of a hydrothermal explosion on July 23, 2024.

Temperature graph with spike and subsequent drop on May 31, 2025, due to Black Diamond Pool eruption
Temperature record from Black Diamond Pool runoff channel on May 31, 2025

Water temperature in a runoff channel of Black Diamond Pool in Biscuit Basin, Yellowstone National Park, measured on May 31, 2025.  The spike and subsequent drop over the span of about four minutes, followed by the low temperature recorded over about the following hour, is due to a small eruption that occurred from the pool at 8:39 p.m. that day.

Water temperature in a runoff channel of Black Diamond Pool in Biscuit Basin, Yellowstone National Park, measured on May 31, 2025.  The spike and subsequent drop over the span of about four minutes, followed by the low temperature recorded over about the following hour, is due to a small eruption that occurred from the pool at 8:39 p.m. that day.

Webcam view of a steaming and murky pool surrounded by barren ground with rocky cliffs in the distance.
Biscuit Basin webcam view

Image from the webcam installed at Biscuit Basin in Yellowstone National Park.  The view is of Black Diamond Pool, where a hydrothermal explosion occurred on July 23, 2024 (many of the rocks behind and to the right of the pool were deposited during that event).  The background cliff is the Summit Lake rhyolite lava flow, which is about 111,000 years old.&n

Image from the webcam installed at Biscuit Basin in Yellowstone National Park.  The view is of Black Diamond Pool, where a hydrothermal explosion occurred on July 23, 2024 (many of the rocks behind and to the right of the pool were deposited during that event).  The background cliff is the Summit Lake rhyolite lava flow, which is about 111,000 years old.&n

Webcam on a mast attached to a battery box on a boardwalk overlooking a murky and steaming pool
Biscuit Basin webcam temporary deployment

Temporary webcam deployed on the boardwalk in Biscuit Basin, Yellowstone National Park.  The pan/tilt/zoom camera provides a static view every 15 minutes and records video on site for later download as needed.  Black Diamond Pool, site of a hydrothermal explosion on July 23, 2024, is in the background.  This work was completed under Yellowstone Nation

Temporary webcam deployed on the boardwalk in Biscuit Basin, Yellowstone National Park.  The pan/tilt/zoom camera provides a static view every 15 minutes and records video on site for later download as needed.  Black Diamond Pool, site of a hydrothermal explosion on July 23, 2024, is in the background.  This work was completed under Yellowstone Nation

barren chalky ground with a milky-blue pool in the middle and a small hill with scrub vegetation in the background
New hydrothermal feature near "Tree Island" in Norris Geyser Basin, Yellowstone National Park

View looking northwest at a new thermal pool in the Porcelain Basin area of Norris Geyser Basin, Yellowstone National Park, that probably formed in a series of mildly explosive events between late December 2024 and early February 2025.  The rocks and white material (silica mud) surrounding the pool were probably ejected as the feature formed.  The pool is

View looking northwest at a new thermal pool in the Porcelain Basin area of Norris Geyser Basin, Yellowstone National Park, that probably formed in a series of mildly explosive events between late December 2024 and early February 2025.  The rocks and white material (silica mud) surrounding the pool were probably ejected as the feature formed.  The pool is

This is a graph showing earthquake magnitudes and equivalent energy release.
Graph showing earthquake magnitudes and equivalent energy release

Graph showing the average annual occurrence and equivalent energy release for earthquakes of different magnitudes. Plot is from the EarthScope Consortium (https://www.iris.edu/hq/inclass/fact-sheet/how_often_do_earthquakes_occ…).

Plot showing acoustic signals over time
May 3, 2025, bolide acoustic signal recorded by infrasound station in Yellowstone National Park

Infrasound recorded on May 3, 2025, at 9:33 p.m. MDT.  This image is the thumbnail for a video posted on the USGS Yellowstone Volcano Observatory website. 

Map of Yellowstone thermal areas with insets showing high-resolution satellite views of selected regions

Map of Yellowstone’s thermal areas. Inset commercial satellite images highlight thermal areas that are mentioned below: Sulphur Hills (©2022, Maxar, USG), Turbid Lake (©2022, Maxar, USG), and Lower Geyser Basin (©2015, Maxar, USG).  This work utilized data made available through the NASA Commercial SmallSat Data Acquisition Program.  We acknowledge th

Map of Yellowstone’s thermal areas. Inset commercial satellite images highlight thermal areas that are mentioned below: Sulphur Hills (©2022, Maxar, USG), Turbid Lake (©2022, Maxar, USG), and Lower Geyser Basin (©2015, Maxar, USG).  This work utilized data made available through the NASA Commercial SmallSat Data Acquisition Program.  We acknowledge th

Two woman point out a pit in snowy landscape with equipment in the pit. Sparse trees and blue sky in background.
Digging through the snow to install a semi-permanent GPS site in Yellowstone National Park

Yellowstone National Park Geology Program team members Samantha Hilburn (left) and Margery Price (right), both Physical Science Technicians, pose with a snow pit dug near Lewis Canyon for installation of a semi-permanent GPS site, installed in collaboration with USGS scientists. USGS photo by Dan Dzurisin, May 2025.

Yellowstone National Park Geology Program team members Samantha Hilburn (left) and Margery Price (right), both Physical Science Technicians, pose with a snow pit dug near Lewis Canyon for installation of a semi-permanent GPS site, installed in collaboration with USGS scientists. USGS photo by Dan Dzurisin, May 2025.

Colored plots showing seismic reflections at the top of the Yellowstone magma chamber, and a cartoon explanation.
Seismic reflections from the top of the magma reservoir beneath Yellowstone Caldera

Seismic reflection data showing the top of the magma reservoir beneath Yellowstone Caldera along a cross section that runs from Canyon Village in the northwest (X) to near Lake Butte in the southeast (X`).  The top panel shows seismic P-wave (compressional wave) reflectivity, with evidence for the sharp reservoir top labeled.

Seismic reflection data showing the top of the magma reservoir beneath Yellowstone Caldera along a cross section that runs from Canyon Village in the northwest (X) to near Lake Butte in the southeast (X`).  The top panel shows seismic P-wave (compressional wave) reflectivity, with evidence for the sharp reservoir top labeled.

Color map showing eruption extent
March 10, 2025—Kīlauea summit eruption reference map

This reference map depicts the Kīlauea summit eruption within Halema‘uma‘u crater that began on December 23, 2024. As of this posting on March 10, the eruption has had twelve episodes, with a thirteenth likely to occur the next 24 hours.

This reference map depicts the Kīlauea summit eruption within Halema‘uma‘u crater that began on December 23, 2024. As of this posting on March 10, the eruption has had twelve episodes, with a thirteenth likely to occur the next 24 hours.

Was this page helpful?