
Photo Contest Winner | March 2020 | USGS at Work
Salt flat at Death Valley
All Multimedia
Access all multimedia to include images, video, audio, webcams, before-after imagery, and more. Filter and explore with filtering options to refine search.
Filter Total Items: 24923

Salt flat at Death Valley
Photo Contest Winner | March 2020 | USGS at Work
Salt flat at Death Valley

Land Use Change (1934 - 2005), Anza Valley, CA
Land use change in the Anza Valley, CA from 1934 to 2005.
Land use change in the Anza Valley, CA from 1934 to 2005.

Map of the super gage site locations in Ohio, Kentucky, and Indiana
Map of the super gage site locations in Ohio, Kentucky, and IndianaMap of the super gage site locations in Ohio, Kentucky, and Indiana
Map of the super gage site locations in Ohio, Kentucky, and Indiana
Map of the super gage site locations in Ohio, Kentucky, and IndianaMap of the super gage site locations in Ohio, Kentucky, and Indiana

Answer: a GPS capable of accurately measuring elevations to within 10 cm (~4 in)
Answer: a GPS capable of accurately measuring elevations to within 10 cm (~4 in)Answer: a GPS capable of accurately measuring elevations to within 10 cm (~4 in). In the summer of 2019, USGS organized a Light Detection and Ranging (LiDAR) survey of the Kīlauea summit and East Rift Zone, including both the Pu‘u ‘Ō‘ō and 2018 lower Puna lava flows.
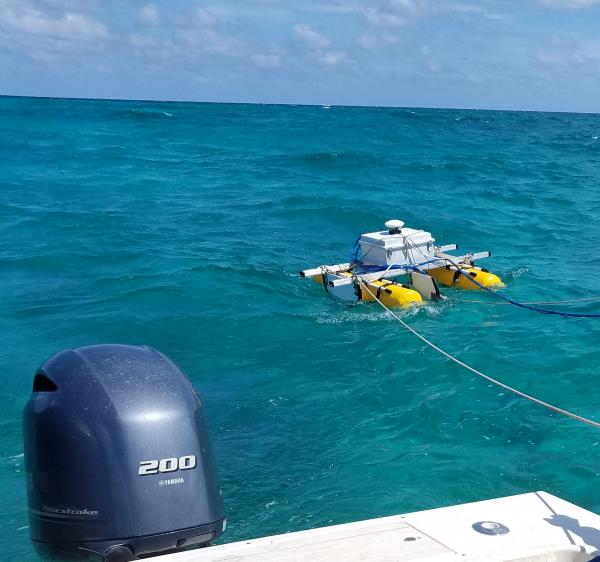
SQUID-5 - Structure-from-Motion Quantitative Underwater Imaging Device
SQUID-5 - Structure-from-Motion Quantitative Underwater Imaging DeviceThe SQUID-5, or a Structure-from-Motion (SfM) Quantitative Underwater Imaging Device with 5 cameras is a towed surface vehicle with an onboard Global Navigation Satellite System (GNSS) and 5 downward-looking cameras with overlapping views of the seafloor.

Winter discharge at Fivemile Creek
Streamflow and water-quality data have been collected at Fivemile Creek near Shoshoni since the 1940s. All data available on line at: http://ow.ly/uraY50ylvIi
Streamflow and water-quality data have been collected at Fivemile Creek near Shoshoni since the 1940s. All data available on line at: http://ow.ly/uraY50ylvIi

State of Our Nation’s Coast Stakeholder Engagement Workshop
State of Our Nation’s Coast Stakeholder Engagement WorkshopParticipants of the Coastal Change Hazards State of Our Nation’s Coast stakeholder engagement workshop at the Waquoit Bay National Estuarine Reserve in Falmouth, MA. Participants are pictured here talking in small groups.

Drilling Through the Ice at Muddy Creek
It took all of the auger flight plus a little to get through ice to the creek. Collecting sample no. 238 from Muddy Ck nr Shoshoni. Monthly samples create a data set that can be used to describe water quality during different seasons and over time.
It took all of the auger flight plus a little to get through ice to the creek. Collecting sample no. 238 from Muddy Ck nr Shoshoni. Monthly samples create a data set that can be used to describe water quality during different seasons and over time.

Image of the Week - When Snowfall Takes Sides
In 2019, a December storm dropped around five inches of snow over northeast China near Baicheng. If conditions on the ground are right, a snow pattern can reveal a storm's path with remarkable detail. Landsat 8 captured this image of the area, revealing a distinct division between snow cover and clear ground.
In 2019, a December storm dropped around five inches of snow over northeast China near Baicheng. If conditions on the ground are right, a snow pattern can reveal a storm's path with remarkable detail. Landsat 8 captured this image of the area, revealing a distinct division between snow cover and clear ground.

State of Our Nation’s Coast Stakeholder Engagement Workshop
State of Our Nation’s Coast Stakeholder Engagement WorkshopA group of participants at the Coastal Change Hazards State of Our Nation’s Coast stakeholder engagement workshop at the Waquoit Bay National Estuarine Reserve in Falmouth, MA. Here participants are pictured writing the names of tools they use on sticky notes.

USGS gage 02171000 Lake Marion Near Pineville, SC

USGS gage 09304800 White River Below Meeker, CO
This is Hydrographer Mark Spindler performing a winter time discharge measurement at USGS stream gage 09304800 White River Below Meeker, CO. Discrete water quality samples were also collected.
This is Hydrographer Mark Spindler performing a winter time discharge measurement at USGS stream gage 09304800 White River Below Meeker, CO. Discrete water quality samples were also collected.

Aerial image and satellite derived image of Florida Lakes
Aerial image and satellite derived image of Florida LakesThis image is a cropped rendition of two aerial images that demonstrate satellite-derived cyanobacteria concentrations in surface waters from an area in Florida.
Aerial image and satellite derived image of Florida Lakes
Aerial image and satellite derived image of Florida LakesThis image is a cropped rendition of two aerial images that demonstrate satellite-derived cyanobacteria concentrations in surface waters from an area in Florida.

Esri Federal GIS Conference 2020 USGS Booth
U.S. Geological Survey booth at the exhibition hall of the 2020 Esri Federal GIS Conference.
U.S. Geological Survey booth at the exhibition hall of the 2020 Esri Federal GIS Conference.

GOMEX box corer
USGS marine engineering technician Dan Powers from the USGS Pacific Coastal and Marine Science Center retrieves the GOMEX box corer from Bellingham Bay, Washington.
USGS marine engineering technician Dan Powers from the USGS Pacific Coastal and Marine Science Center retrieves the GOMEX box corer from Bellingham Bay, Washington.

Two USGS employees conducting an under-ice ADCP discharge measurement.
Two USGS employees conducting an under-ice ADCP discharge measurement.Two USGS employees (Bart Dengel, and Joseph Crissup) conducting an under-ice ADCP discharge measurement near USGS stream gage station 15214000.
Two USGS employees conducting an under-ice ADCP discharge measurement.
Two USGS employees conducting an under-ice ADCP discharge measurement.Two USGS employees (Bart Dengel, and Joseph Crissup) conducting an under-ice ADCP discharge measurement near USGS stream gage station 15214000.

Maps displaying the spatial-temporal variability in the NPPSD 3.0 data
Maps displaying the spatial-temporal variability in the NPPSD 3.0 dataMaps displaying the spatial-temporal variability in the NPPSD 3.0 dataset
Maps displaying the spatial-temporal variability in the NPPSD 3.0 data
Maps displaying the spatial-temporal variability in the NPPSD 3.0 dataMaps displaying the spatial-temporal variability in the NPPSD 3.0 dataset

Eyes on Earth Episode 16 – Predictive Modeling
Land cover and land use across the United States are the culmination of a complex web of interwoven factors: Climate, landscape types, and economic factors among them. Remotely-sensed data from satellites like Landsat and a variety of other sources are useful for documenting and monitoring land cover and land use.
Land cover and land use across the United States are the culmination of a complex web of interwoven factors: Climate, landscape types, and economic factors among them. Remotely-sensed data from satellites like Landsat and a variety of other sources are useful for documenting and monitoring land cover and land use.

Caitlin Reynolds with a sediment trap in the Gulf of Mexico
Caitlin Reynolds with a sediment trap in the Gulf of MexicoCaitlin Reynolds of the USGS St. Petersburg Coastal and Marine Science Center secures a sediment trap, retrieved from the bottom of the Gulf of Mexico on board the R/V Pelican.
Caitlin Reynolds with a sediment trap in the Gulf of Mexico
Caitlin Reynolds with a sediment trap in the Gulf of MexicoCaitlin Reynolds of the USGS St. Petersburg Coastal and Marine Science Center secures a sediment trap, retrieved from the bottom of the Gulf of Mexico on board the R/V Pelican.

Retrieving a sediment trap in the Gulf of Mexico
A large winch on the stern of R/V Pelican is used to retrieve two sediment traps from the bottom of the Gulf of Mexico.
A large winch on the stern of R/V Pelican is used to retrieve two sediment traps from the bottom of the Gulf of Mexico.

Sunset on a research vessel in the Gulf of Mexico
A beautiful sun set over the Gulf of Mexico from the stern of the R/V Pelican.
A beautiful sun set over the Gulf of Mexico from the stern of the R/V Pelican.