
Welcome to the "The I Am A..." series. This is the third video in a series of USGS whiteboard animations that highlight USGS careers.
All Multimedia
Access all multimedia to include images, video, audio, webcams, before-after imagery, and more. Filter and explore with filtering options to refine search.
Filter Total Items: 24923

I Am A...Fire Ecologist
Welcome to the "The I Am A..." series. This is the third video in a series of USGS whiteboard animations that highlight USGS careers.

May the Quartz Be With You
As part of Earth Science Week 2020, USGS scientist Shannon Mahan takes us on a tour of quartz and how geologists like her use quartz to study all kinds of things, from earthquakes to archaeology.
As part of Earth Science Week 2020, USGS scientist Shannon Mahan takes us on a tour of quartz and how geologists like her use quartz to study all kinds of things, from earthquakes to archaeology.

Third Creek, NV
View of near shore Third Creek, NV
View of near shore Third Creek, NV
")
Bathymetry: Mapping the depth of Tampa Bay with USGS (Teaser)
Bathymetry: Mapping the depth of Tampa Bay with USGS (Teaser)Join the USGS St. Petersburg Coastal and Marine Science Center on an adventure in the field! Our team of scientists will take you on board a personal watercraft near downtown St. Pete to show you how they collect bathymetry data – which is the depth of the ocean floor (in this case, Tampa Bay). This video was created as part of the 2020 St.

Scientists installing a lahar monitoring station.
Lahar monitoring equipment is housed in a secure box with multiple types of instruments to detect approaching lahars.
Lahar monitoring equipment is housed in a secure box with multiple types of instruments to detect approaching lahars.

U.S. River Conditions, July to September 2020
This is an animation showing the changing conditions of USGS streamgages from July 1, 2020 to September 30, 2020. The conditions shown range from the driest condition seen at a gage (red open circles) to the wettest (blue closed circles). There is also a purple ring added to indicate gages that are flooding.
This is an animation showing the changing conditions of USGS streamgages from July 1, 2020 to September 30, 2020. The conditions shown range from the driest condition seen at a gage (red open circles) to the wettest (blue closed circles). There is also a purple ring added to indicate gages that are flooding.

U.S. River Conditions, Water Year 2020
This animation shows the changing conditions of USGS streamgages from October 1, 2019 to September 30, 2020. The conditions shown range from the driest condition seen at a gage (red open circles) to the wettest (blue closed circles). There is also a purple ring added to indicate gages that are flooding.
This animation shows the changing conditions of USGS streamgages from October 1, 2019 to September 30, 2020. The conditions shown range from the driest condition seen at a gage (red open circles) to the wettest (blue closed circles). There is also a purple ring added to indicate gages that are flooding.

Yellowstone Volcano Observatory Monthly Update: October 1, 2020
Yellowstone Volcano Observatory Monthly Update: October 1, 2020Mike Poland, Scientist-in-Charge of the Yellowstone Volcano Observatory, gives an overview of activity at Yellowstone during September 2020.
Yellowstone Volcano Observatory Monthly Update: October 1, 2020
Yellowstone Volcano Observatory Monthly Update: October 1, 2020Mike Poland, Scientist-in-Charge of the Yellowstone Volcano Observatory, gives an overview of activity at Yellowstone during September 2020.

Close-up image of native sulfur crystals
A close-up image of native sulfur crystals that formed within fumaroles at the Sulphur Banks in Hawai‘i Volcanoes National Park. In addition to sulfur species and other gases, volcanoes emit water vapor. Here, some of the vapor has condensed to liquid water and formed droplets visible on the sulfur crystals. USGS photo by P. Nadeau.
A close-up image of native sulfur crystals that formed within fumaroles at the Sulphur Banks in Hawai‘i Volcanoes National Park. In addition to sulfur species and other gases, volcanoes emit water vapor. Here, some of the vapor has condensed to liquid water and formed droplets visible on the sulfur crystals. USGS photo by P. Nadeau.

Collecting a red-dye sample in Olathe, Kansas
USGS scientist uses a weighted basket sampler to collect a Time of Travel red-dye sample at WaterOne in Olathe, Kansas.
USGS scientist uses a weighted basket sampler to collect a Time of Travel red-dye sample at WaterOne in Olathe, Kansas.

Crystals of pure native sulfur at sites of degassing called fumaroles
Crystals of pure native sulfur at sites of degassing called fumarolesDifferent sulfur gases, including sulfur dioxide (SO2) and hydrogen sulfide (H2S), can react with each other to deposit crystals of pure native sulfur at sites of degassing called fumaroles. The crystals picture here formed within a Sulphur Banks area fumarole in Hawai‘i Volcanoes National Park. USGS photo by T. Elias.

graphic showing gallons in a cubic foot
graphic showing gallons in a cubic foot

graphic showing volume of acre foot on football field
graphic showing volume of acre foot on football fieldgraphic showing volume of acre foot on football field
graphic showing volume of acre foot on football field
graphic showing volume of acre foot on football fieldgraphic showing volume of acre foot on football field

HVO gas scientists collected helium samples
As part of routine monitoring efforts, HVO gas scientists collected helium samples from fumaroles in the Sulphur Banks, or Ha‘akulamanu, area of Hawai‘i Volcanoes National Park on September 30, 2020. Helium can pass through the glass of typical gas sampling bottles, so copper tubing is necessary for the specialized sample.
As part of routine monitoring efforts, HVO gas scientists collected helium samples from fumaroles in the Sulphur Banks, or Ha‘akulamanu, area of Hawai‘i Volcanoes National Park on September 30, 2020. Helium can pass through the glass of typical gas sampling bottles, so copper tubing is necessary for the specialized sample.

Mapping river bathymetry in the Copper River Delta, Alaska
Mapping river bathymetry in the Copper River Delta, AlaskaUSGS scientists Robin Beebee (left) and Jeff Conaway use a boat-mounted multibeam echosounder to map river bathymetry around bridge piers in the Copper River Delta of Alaska. The bathymetric mapping is part of a streambed scour study conducted in cooperation with the Alaska Department of Transportation and Public Facilities.

Tubing inserted into a fumarole
Tubing inserted into a fumarole at the Sulphur Banks in Hawai‘i Volcanoes National Park allows HVO gas scientists to sample gas. The gas travels through the tube into gas sampling bottles for later analyses. USGS photo by M. Warren.
Tubing inserted into a fumarole at the Sulphur Banks in Hawai‘i Volcanoes National Park allows HVO gas scientists to sample gas. The gas travels through the tube into gas sampling bottles for later analyses. USGS photo by M. Warren.
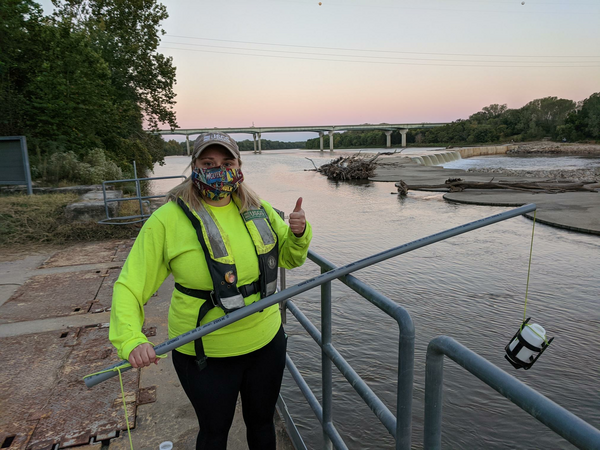
USGS scientist prepares to collect a red-dye sample in Olathe, Kansas
USGS scientist prepares to collect a red-dye sample in Olathe, KansasUSGS scientist Chantelle Davis prepares to collect a red-dye sample, at sunrise, for the Time of Travel study in Olathe, Kansas.
USGS scientist prepares to collect a red-dye sample in Olathe, Kansas
USGS scientist prepares to collect a red-dye sample in Olathe, KansasUSGS scientist Chantelle Davis prepares to collect a red-dye sample, at sunrise, for the Time of Travel study in Olathe, Kansas.

Earth MRI Funds Critical Minerals Projects in West Virginia
Earth MRI Funds Critical Minerals Projects in West VirginiaUSGS map of Earth MRI projects in West Virginia announced in September 2020.
Earth MRI Funds Critical Minerals Projects in West Virginia
Earth MRI Funds Critical Minerals Projects in West VirginiaUSGS map of Earth MRI projects in West Virginia announced in September 2020.
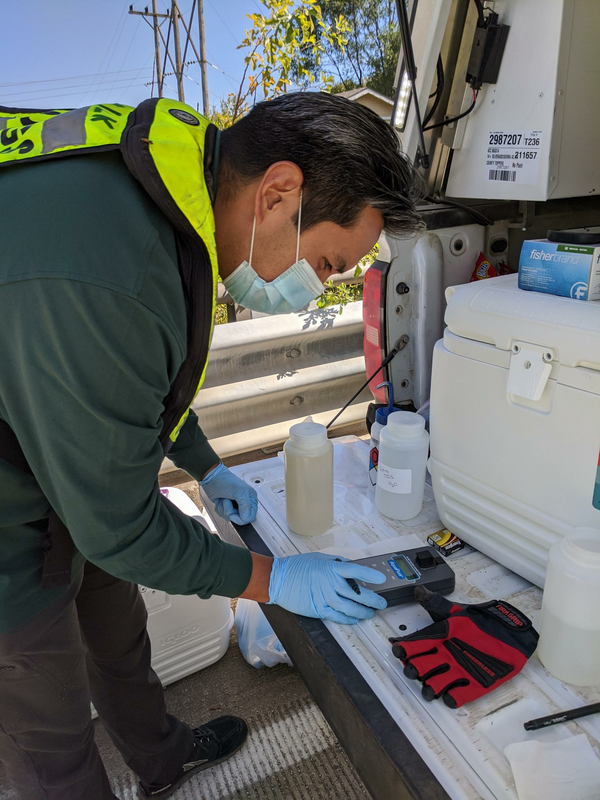
Getting a field fluorometer reading from a red-dye study sample
Getting a field fluorometer reading from a red-dye study sampleUSGS scientist Ian Gambill gets a field fluorometer reading from a recently collected red-dye study sample from the Kansas River in DeSoto, Kansas.
Getting a field fluorometer reading from a red-dye study sample
Getting a field fluorometer reading from a red-dye study sampleUSGS scientist Ian Gambill gets a field fluorometer reading from a recently collected red-dye study sample from the Kansas River in DeSoto, Kansas.

Iron Spring outflow at Fountain Creek near Manitou Springs, Colorado
Iron Spring outflow at Fountain Creek near Manitou Springs, ColoradoSprings discharging from the artesian aquifer are commonly supersaturated with minerals. In this photo at Iron Spring a small mound of iron hydroxides is forming below where the spring outflows to Fountain Creek.

Portable single-beam echo sounder set-up
Marine engineering technician Pete Dal Ferro sets up a newly acquired, portable, single-beam echo sounder on the San Lorenzo River in Santa Cruz, California. The new device, called CEESCOPE, collects bathymetric (depth) data and also records features of the subsurface.
Marine engineering technician Pete Dal Ferro sets up a newly acquired, portable, single-beam echo sounder on the San Lorenzo River in Santa Cruz, California. The new device, called CEESCOPE, collects bathymetric (depth) data and also records features of the subsurface.