
Medicine Lake, California simplified hazards map showing potential impact area for ground-based hazards during a volcanic event.
Images
Explore our planet through photography and imagery, including climate change and water all the way back to the 1800s when the USGS was surveying the country by horse and buggy.
Filter Total Items: 21345

Medicine Lake, CA simplified hazards map
Medicine Lake, California simplified hazards map showing potential impact area for ground-based hazards during a volcanic event.

Methane plume
Methane plume imaged by the 30 kHz multibeam system
Methane plume imaged by the 30 kHz multibeam system

Methane Plumes
(Top) Methane plumes at the Norfolk Canyon seeps (~1600 meters or 5250 feet) were detected using the EK60 sonar. The water column plumes are shown above the sub-seafloor structure as imaged by high-resolution multichannel seismic data acquired by the USGS and processed by J. Kluesner.
(Top) Methane plumes at the Norfolk Canyon seeps (~1600 meters or 5250 feet) were detected using the EK60 sonar. The water column plumes are shown above the sub-seafloor structure as imaged by high-resolution multichannel seismic data acquired by the USGS and processed by J. Kluesner.

Methane-derived authigenic carbonate (MDAC) rocks on the seafloor
Methane-derived authigenic carbonate (MDAC) rocks on the seafloorMethane-derived authigenic carbonate (MDAC) rocks on the seafloor on the U.S. Atlantic margin
Methane-derived authigenic carbonate (MDAC) rocks on the seafloor
Methane-derived authigenic carbonate (MDAC) rocks on the seafloorMethane-derived authigenic carbonate (MDAC) rocks on the seafloor on the U.S. Atlantic margin

Monarch on hairy puccoon
A monarch butterfly on a hairy puccoon plant.
A monarch butterfly on a hairy puccoon plant.

Monarch on Joe Pyeweed plant
Monarch butterfly on a Joe Pyeweed plant.
Monarch butterfly on a Joe Pyeweed plant.

Monitoring at Little Stony Creek above Archer Trail near Pembroke, VA
Monitoring at Little Stony Creek above Archer Trail near Pembroke, VAWater monitoring at Little Stony Creek above Archer Trail near Pembroke, VA
Monitoring at Little Stony Creek above Archer Trail near Pembroke, VA
Monitoring at Little Stony Creek above Archer Trail near Pembroke, VAWater monitoring at Little Stony Creek above Archer Trail near Pembroke, VA
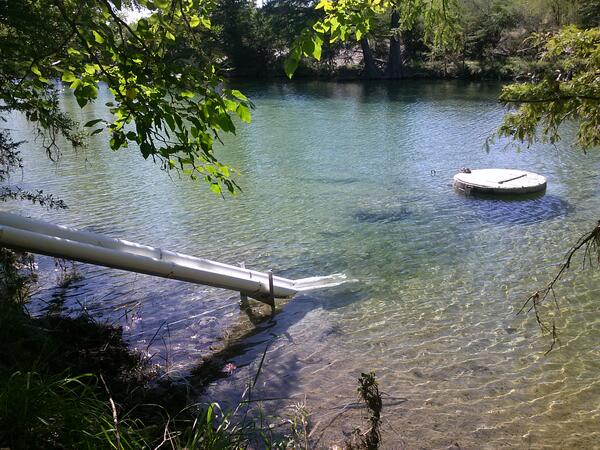
Monitoring equipment at Frio River at Concan, Tex.
Monitoring equipment at Frio River at Concan, Tex.Monitoring equipment at Frio River at Concan, Tex.
Monitoring equipment at Frio River at Concan, Tex.
Monitoring equipment at Frio River at Concan, Tex.Monitoring equipment at Frio River at Concan, Tex.
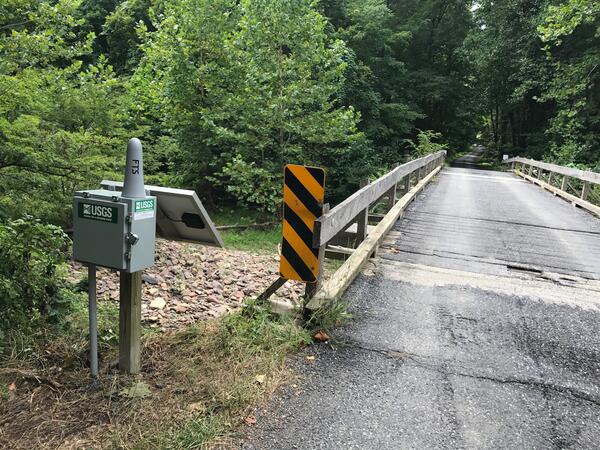
Monitoring Ramseys Draft at Route 716 near West Augusta
Monitoring Ramseys Draft at Route 716 near West AugustaMonitoring Ramseys Draft at Route 716 near West Augusta
Monitoring Ramseys Draft at Route 716 near West Augusta
Monitoring Ramseys Draft at Route 716 near West AugustaMonitoring Ramseys Draft at Route 716 near West Augusta

Monitoring Roanoke River along Route 626 at Lafayette, VA
Monitoring Roanoke River along Route 626 at Lafayette, VAMonitoring Roanoke River along Route 626 at Lafayette, VA
Monitoring Roanoke River along Route 626 at Lafayette, VA
Monitoring Roanoke River along Route 626 at Lafayette, VAMonitoring Roanoke River along Route 626 at Lafayette, VA
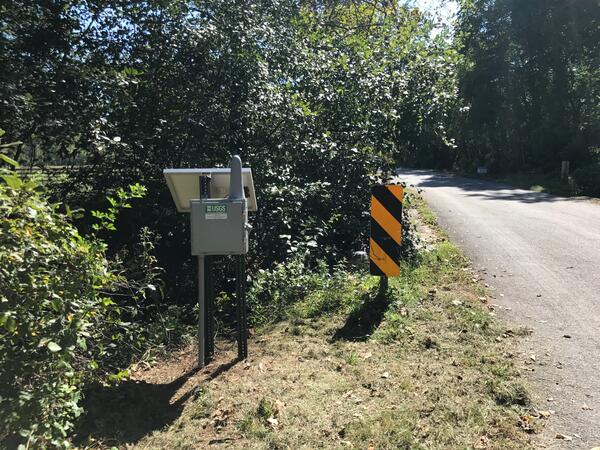
Monitoring Spruce Creek at Route 627 near Nellysford, VA
Monitoring Spruce Creek at Route 627 near Nellysford, VAMonitoring Spruce Creek at Route 627 near Nellysford, VA
Monitoring Spruce Creek at Route 627 near Nellysford, VA
Monitoring Spruce Creek at Route 627 near Nellysford, VAMonitoring Spruce Creek at Route 627 near Nellysford, VA

Mount Baker, WA simplified hazards map
Mount Baker, Washington simplified hazards map showing potential impact area for ground-based hazards during a volcanic event.
Mount Baker, Washington simplified hazards map showing potential impact area for ground-based hazards during a volcanic event.

Mountain and Mojave Desert
Landscape shot of a mountain and the low elevation Mojave Desert.
Landscape shot of a mountain and the low elevation Mojave Desert.

Multicorer deployment to sample the seafloor
USGS ocean engineers Peter Dal Ferro and Gerry Hatcher, from the Pacific Coastal and Marine Science Center in Santa Cruz, California, deploying a multicorer to sample the seafloor near an Atlantic margin methane seep site.
USGS ocean engineers Peter Dal Ferro and Gerry Hatcher, from the Pacific Coastal and Marine Science Center in Santa Cruz, California, deploying a multicorer to sample the seafloor near an Atlantic margin methane seep site.

Multicores
Multicores collected from the northern Gulf of Mexico. These cores contain roughly 1 meter of sediment from the seafloor, and represent the past ~2000 years of deposition.
Multicores collected from the northern Gulf of Mexico. These cores contain roughly 1 meter of sediment from the seafloor, and represent the past ~2000 years of deposition.

Native Habitat, Mid-Elevation Mojave
Picture of a mid-elevation plant community in the Mojave Desert.
Picture of a mid-elevation plant community in the Mojave Desert.

Nitrate sensor at the Frio River at Concan, Tex.
Back cover photo from

Occurrence of microcystins in lakes in the contiguous US 48 states
Occurrence of microcystins in lakes in the contiguous US 48 statesUnited States occurrence of microcystins in lakes in the contiguous 48 U.S. states categorized by World Health Organization relative probable health risk. WHO low, moderate, and high refer to the relative human recreational health thresholds for microcystin exposure. Map not shown to scale.

PCMSC Marine Minerals Laboratory
A look into the USGS Pacific Coastal and Marine Science Center’s Marine Minerals Laboratory Suite.
A look into the USGS Pacific Coastal and Marine Science Center’s Marine Minerals Laboratory Suite.

PCMSC Marine Minerals Laboratory
A look into the USGS Pacific Coastal and Marine Science Center’s Marine Minerals Laboratory Suite.
A look into the USGS Pacific Coastal and Marine Science Center’s Marine Minerals Laboratory Suite.

PCMSC Marine Minerals Laboratory
A look into the USGS Pacific Coastal and Marine Science Center’s Marine Minerals Laboratory Suite.
A look into the USGS Pacific Coastal and Marine Science Center’s Marine Minerals Laboratory Suite.