
U.S. flag

An official website of the United States government

Images

Coastal and Marine Hazards and Resources Program images.

Filter Total Items: 2413
Animation of a plot displaying beach elevation over time
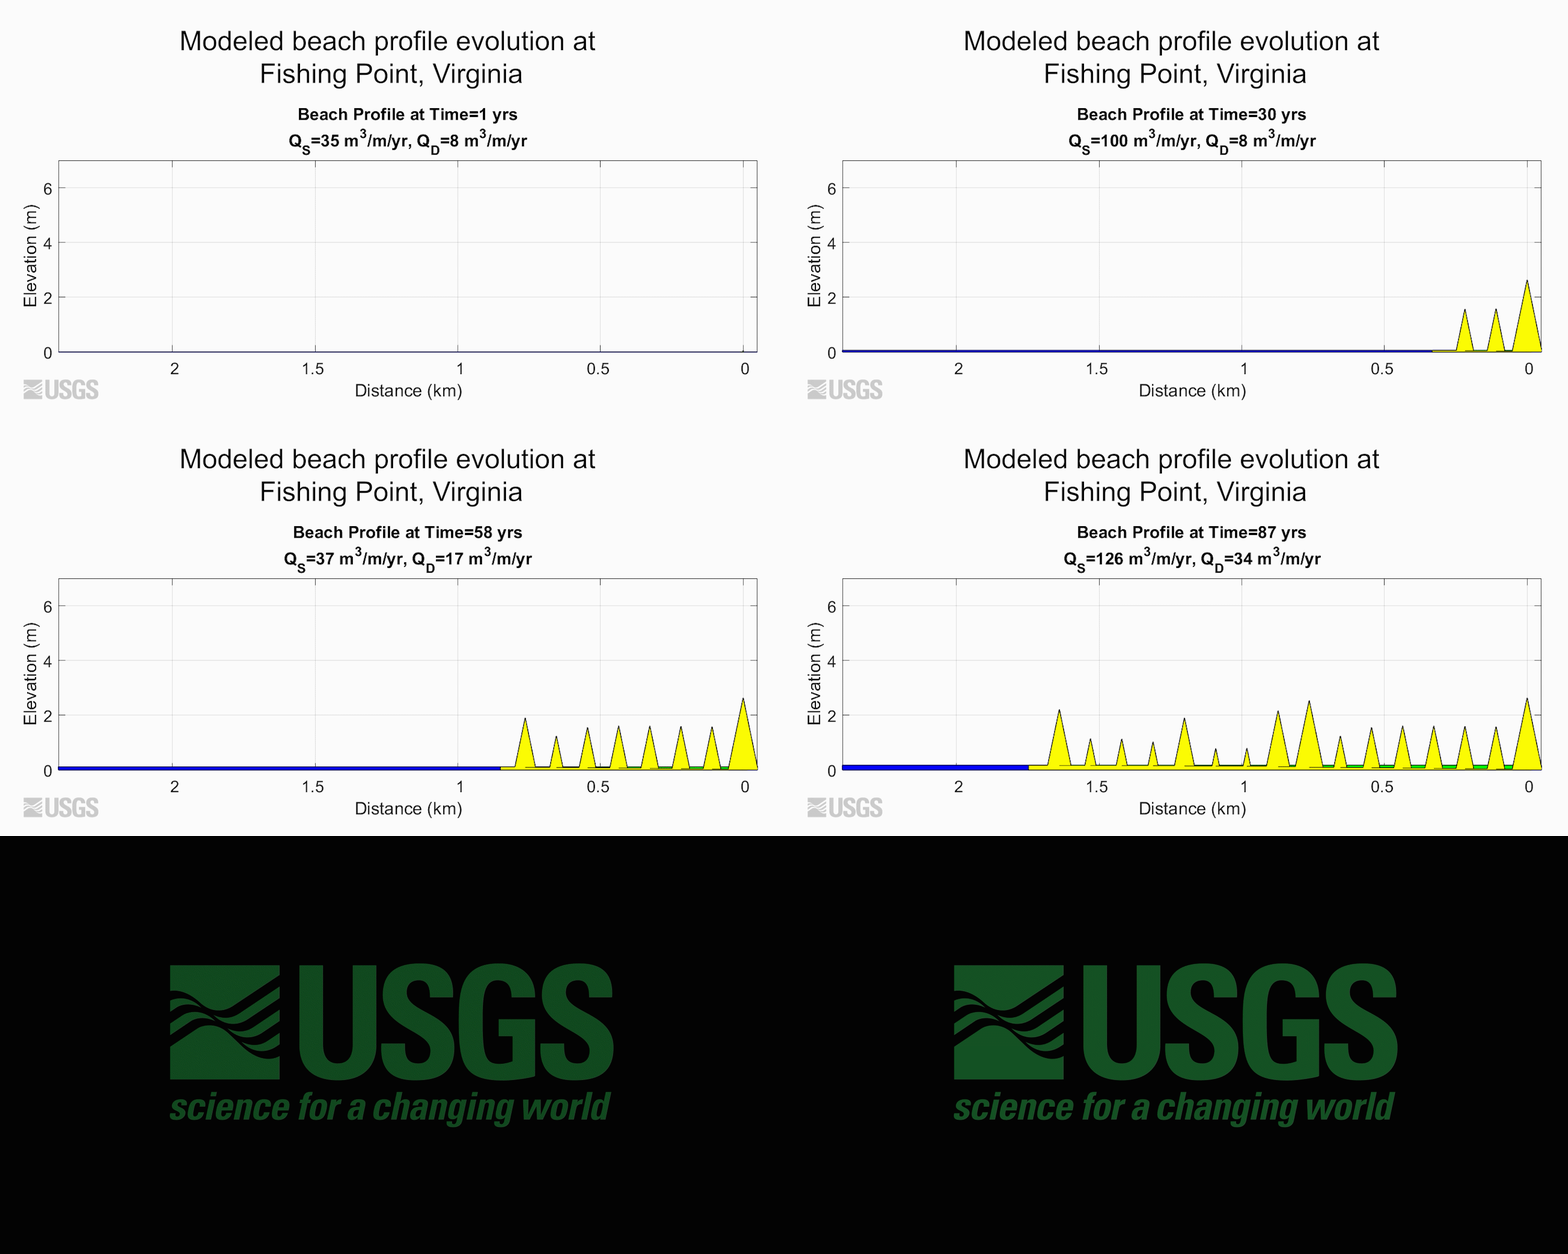
Modeled beach profile evolution at Fishing Point, Virginia

Animation displays modeled beach profile elevation as it has evolved at Fishing Point, Virginia. These data are based on historical charts and images and measure distance (in kilometers) of cross-shore accretion. QS is the flux of sand to the beach, and QD is the flux of sand from the beach to the active dune.

Animation displays modeled beach profile elevation as it has evolved at Fishing Point, Virginia. These data are based on historical charts and images and measure distance (in kilometers) of cross-shore accretion. QS is the flux of sand to the beach, and QD is the flux of sand from the beach to the active dune.

Aerial photograph showing a fiord and bay area, labeled with features like fan deltas from rivers.
Overview of Taan Fiord

Overview of Taan Fiord. Inset showing location of Taan Fiord, Alaska in Wrangell St. Elias National Park and Preserve. Taan Fiord is about 100 km from the nearest town, Yakutat, AK. Landsat 8 image of Taan Fiord acquired in 2016. Vegetation loss is clear near the water line.

Overview of Taan Fiord. Inset showing location of Taan Fiord, Alaska in Wrangell St. Elias National Park and Preserve. Taan Fiord is about 100 km from the nearest town, Yakutat, AK. Landsat 8 image of Taan Fiord acquired in 2016. Vegetation loss is clear near the water line.

A man navigates a personal watercraft slowly out of a harbor along a jetty.
Personal watercraft equipped with sonar and GPS

A USGS scientist navigates a personal watercraft (PWC) slowly through Elkhorn Slough. The PWC is equipped with an echosounder and GPS, to record accurate depth and location. This mapping effort is part of recurring surveys in the Monterey Bay area.

A USGS scientist navigates a personal watercraft (PWC) slowly through Elkhorn Slough. The PWC is equipped with an echosounder and GPS, to record accurate depth and location. This mapping effort is part of recurring surveys in the Monterey Bay area.

A person navigates a personal watercraft in the nearshore with coastal bluffs in the background.
Collecting nearshore bathymetry data off Rio del Mar

A USGS scientist navigates a personal watercraft equipped with sonar and GPS to collect depth information (bathymetry) of the nearshore. This mapping effort is part of recurring surveys in the Monterey Bay area.

A USGS scientist navigates a personal watercraft equipped with sonar and GPS to collect depth information (bathymetry) of the nearshore. This mapping effort is part of recurring surveys in the Monterey Bay area.

A young woman walks along the sand wearing a backpack with light equipment in it.
Collecting beach profile data with GPS

A USGS scientist walks along Santa Cruz Main Beach at the edge of the San Lorenzo River in Santa Cruz, California, wearing a backpack with GPS equipment. She is collecting elevation data that will be used to create a topographic map of the beach. This mapping effort is part of recurring surveys in the Monterey Bay area.

A USGS scientist walks along Santa Cruz Main Beach at the edge of the San Lorenzo River in Santa Cruz, California, wearing a backpack with GPS equipment. She is collecting elevation data that will be used to create a topographic map of the beach. This mapping effort is part of recurring surveys in the Monterey Bay area.

Iguana
Iguana in Marine Lab

Iguana in the marine science laboratory at the university of Puerto Rico Isla Magueyes in La Parguera, Puerto Rico.

Iguana in the marine science laboratory at the university of Puerto Rico Isla Magueyes in La Parguera, Puerto Rico.

Map
Regional Map of Puerto Rico

Regional map of Puerto Rico. Less than two months after the largest earthquake in the seismic sequence, the USGS Woods Hole Coastal and Marine Science Center organized a rapid response seismic survey.

Regional map of Puerto Rico. Less than two months after the largest earthquake in the seismic sequence, the USGS Woods Hole Coastal and Marine Science Center organized a rapid response seismic survey.

People working on boat in body of water
Deploying streamer
Deploying streamer
Group of people posing for photo
Group Photo in Puerto Rico

From left to right – Uri ten Brink, Eric Moore, Wayne Baldwin, Alex Nichols, Jason Chaytor, and Captain Orlando Espinoza. Less than two months after the largest earthquake in the seismic sequence, the USGS Woods Hole Coastal and Marine Science Center organized a rapid response seismic survey.

From left to right – Uri ten Brink, Eric Moore, Wayne Baldwin, Alex Nichols, Jason Chaytor, and Captain Orlando Espinoza. Less than two months after the largest earthquake in the seismic sequence, the USGS Woods Hole Coastal and Marine Science Center organized a rapid response seismic survey.

boat at dock
R/V Sultana
R/V Sultana
R/V Sultana

R/V Sultana. Less than two months after the largest earthquake in the seismic sequence, the USGS Woods Hole Coastal and Marine Science Center organized a rapid response seismic survey.

R/V Sultana. Less than two months after the largest earthquake in the seismic sequence, the USGS Woods Hole Coastal and Marine Science Center organized a rapid response seismic survey.

Photograph of Woods Hole Coastal and Marine Science Center Sediment Analysis Laboratory showing the laboratory computer workstat
Woods Hole Coastal and Marine Science Center Sediment Analysis Lab

View inside the Woods Hole Coastal and Marine Science Center Sediment Analysis Laboratory showing the laboratory computer workstation, precision balances, and interior of the oven and sieving room.

Photograph of the View inside the Woods Hole Coastal and Marine Science Center Sediment Analysis Laboratory showing the Beckman
Woods Hole Sediment Analysis Lab

View inside the Woods Hole Coastal and Marine Science Center Sediment Analysis Laboratory showing the Beckman Coulter Multisizer 3 and Horiba LA-960 laser diffraction unit.

View inside the Woods Hole Coastal and Marine Science Center Sediment Analysis Laboratory showing the Beckman Coulter Multisizer 3 and Horiba LA-960 laser diffraction unit.

Four panel image displaying corals in degraded versus good condition up close and on a coral reef.
Lesson plan key for identifying coral condition

Key used in an educational lesson plan for identifying the composition and condition of corals and coralline algae in a core. (a) Two examples of Pocillopora in good taphonomic condition (<50% erosion or encrustation of the skeleton).

Key used in an educational lesson plan for identifying the composition and condition of corals and coralline algae in a core. (a) Two examples of Pocillopora in good taphonomic condition (<50% erosion or encrustation of the skeleton).

A woman points to a figure on a poster
Davina Passeri presents poster about coastal change research

Davina Passeri of the St. Petersburg Coastal and Marine Science Center presents a poster about coastal change research in Dauphin Island, Alabama at the USGS Southeast Regional Meeting in February 2020.

A woman talks to a group of people standing in front of a poster
Ilsa Kuffner presents a poster on coral research

Ilsa Kuffner speaks to a group at the USGS Southeast Regional Meeting in February 2020 about coral research conducted by the St. Petersburg Coastal and Marine Science Center

A group of six photographs showing equipment used for collecting data in the field.
Field equipment for bathymetric and topographic surveys

Field equipment used by USGS Pacific Coastal and Marine Science Center scientists for bathymetric and topographic surveys in the Sacramento-San Joaquin Delta, California

Two people look into a laboratory
Sediment laboratory at St. Petersburg Coastal & Marine Science Center
A woman stands behind a table under a tent with a poster behind her
Kathryn Smith at an Outreach Event

The USGS St. Petersburg Coastal and Marine Science Center conducted outreach at the Localtopia Event held in February 2020. Staff demonstrated a simulation of how storms can impact sandy coastlines through processes such as erosion.

The USGS St. Petersburg Coastal and Marine Science Center conducted outreach at the Localtopia Event held in February 2020. Staff demonstrated a simulation of how storms can impact sandy coastlines through processes such as erosion.

Was this page helpful?