
a view of a laptop computer connected to 2 monitors and a microplate reader. The monitors display data generated from an assay including a standard curve.
Functional and Molecular Bioassay Core Technology Team
Active
By Environmental Health Program
February 28, 2024
Primary leukocytes have been isolated from experimental fish
USGS scientist preparing plates for yeast bioassay screening
Primary hepatocytes isolated from experimental smallmouth bass
nCounter SPRINT† system simultaneously analyzes transcript abundance
Image-based flow cytometer for cell population analysis
About the Research
The Functional and Molecular Bioassay Core Technology Team (CTT) as part of the Environmental Health Program utilizes reporter assays, quantitative gene expression analyses, and high-throughput sequencing methods to produce functional endpoints across a broad scope of environmental topics and sample matrices.
The Functional and Molecular Bioassay CTT applies and modifies microbial and eukaryotic reporter bioassays to detect the presence of bioactive chemicals in environmental water samples.
These analyses compliment analytical chemistry and biological datasets. Analyses include functional endpoints and quantitative gene expression analysis, utilizing both designed codesets and/or custom oligos. In the instance of insufficient genetic data for the non-model species of interest, the laboratory establishes in-house de novo sequence databases via high throughput sequencing methods. Bioassay capabilities were recently expanded by incorporating high content screening using a ImageExpress Pico. Methods adoption and development on this instrument include: functional immune assays previously run using microplates or flow cytometry, genetically engineered translocation-based assay to evaluate nuclear receptor binding, and cytotoxicity-based endpoints.
Key Analytical Capabilities
- Bioassay screening for genotoxic, mutagenic and endocrine active compounds
- In vitro screening and molecular/ functional response profiling of cultured cells
- Automated cell imaging and High Content Screening
- Functional genomics, quantitative gene expression analysis (quantitative polymerase chain reaction [qPCR] or digital, absolute copy measurements)
- Identification of biomarker genes in non-model organisms
- Virus discovery
Key Instrumentation
- Multimode plate reader for bioassay end-point measurements and ELISA
- nCounter Max (Nanostring) for multiplex, digital, gene expression analysis
- QX200 Droplet Digital PCR System
- QuantStudio 5 Real-Time PCR System
- High throughput sequencing (MiSeq)
- Image analysis-based flow cytometric analysis for functional cell assays
- ImageXpress Pico
- Extraction equipment for solid phase extraction of water samples


Environmental Health Integrated Science Team Collaborators
Environmental Health Integrated Science Team Collaborators
-

Drinking Water and Wastewater Infrastructure Science Team
The team studies toxicants and pathogens in water resources from their sources, through watersheds, aquifers, and infrastructure to human and wildlife exposures. That information is used to develop decision tools that protect human and wildlife health.
Immunomodulation Science Team
The Immunomodulation Integrated Science Team focuses on contaminant and pathogen exposures in the environment that might influence the immune systems of wildlife and the connection to their shared environment with humans. In collaboration with public-health officials, the Team also addresses potential human-health risks stemming from similar exposures. If actual risks are identified, this Team...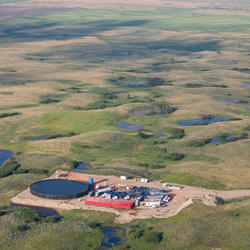
Energy Resources Life Cycle Integrated Science Team
The Energy Resources Life Cycle Integrated Science Team focuses on the potential for environmental contaminant exposures that might originate from energy resource activities including extraction, production, transportation, storage, waste management, and restoration. Perceived health risks to humans and other organisms will be distinguished from actual risks, if any. If actual risks are identified...
Food Resources Lifecycle Integrated Science Team
The team studies the movement of toxicants and pathogens that could originate from the growing, raising, and processing/manufacturing of plant and animal products through the environment where exposure can occur. This information is used to understand if there are adverse effects upon exposure and to develop decision tools to protect health.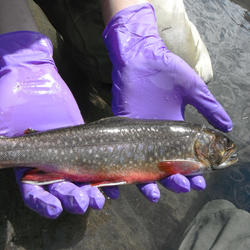
Fishing, Hunting and Subsistence Living Integrated Science Team
The Fishing, Hunting, and Subsistence Living Integrated Science Team focuses on contaminant and pathogen exposures in the environment that could impact the presence and vitality of fish and wildlife populations that drive commercial, recreational and subsistence activities such as hunting and fishing. If actual risks are identified this project will inform how to economically and effectively...
Science activities related to the Functional and Molecular Bioassay Core Technology Team can be found below.

Agricultural best management practices can improve water quality and conditions for fisheries in the Chesapeake Bay Watershed
Issue Partners in the Chesapeake Bay Program (CBP) are implementing best management practices (BMPs) to prevent nutrient and sediment from entering waterways across the Chesapeake watershed and reduce loads to the Bay. In addition to reducing nutrients, CBP partners want to better understand how BMPs can provide additional benefits for addressing toxic contaminants, such as pesticides, hormones...

Fish and Aquatic Animal Health Publications, 2021 – 2022
Below are journal articles about fish and aquatic animal health from the Eastern Ecological Science Center published in 2021 and 2022.

Human and Ecological Health Impacts Associated with Water Reuse and Conservation Practices
Human and Ecological Health Impacts Associated with Water Reuse and Conservation Practices

Endocrine Disrupting Chemicals and Prevalence of Intersex in Fish Populations in New Jersey
Endocrine disrupting chemicals (EDCs) are compounds with the potential to interfere with normal endocrine communication in organisms.

Prevalence of novel, emerging hepatitis viruses in wild white suckers and their association with liver tumors in the Great Lakes region
Prevalence of novel, emerging hepatitis viruses in wild white suckers and their association with liver tumors in the Great Lakes region

Endocrine Disrupting Chemicals and Prevalence of Intersex in Fish Populations in New Jersey
NJ WSC and Leetown Science Center scientists in cooperation with the New Jersey Department of Environmental Protection were tasked with characterizing endocrine disruption in smallmouth bass from New Jersey.
Multimedia items related to the Functional and Molecular Bioassay Core Technology Team can be found below.

EESC Microplate Reader
a view of a laptop computer connected to 2 monitors and a microplate reader. The monitors display data generated from an assay including a standard curve.

Bioassay Dilution Gradient
Overhead view of a microplate with a dilution gradient. The targeted bioassay is designed to identify bioreactivity at varying concentrations.
Overhead view of a microplate with a dilution gradient. The targeted bioassay is designed to identify bioreactivity at varying concentrations.

nCounterMax Automated Prep Station
image of the automated prep station for the Nanostring nCounter Max. The device prepares cartridges for CodeSet Gene Expression Analysis
image of the automated prep station for the Nanostring nCounter Max. The device prepares cartridges for CodeSet Gene Expression Analysis

C. Raines Blotchy Bass Swab
Clay Raines, a USGS scientist, performing a dermal swab on a Largemouth Bass at a Bass Pro Shops retail store with a presumptive case of blotchy bass syndrome. The collected swabs can be used to isolate DNA and RNA which can be used to identify pathogens including those associated with hyperpigmentation.
Clay Raines, a USGS scientist, performing a dermal swab on a Largemouth Bass at a Bass Pro Shops retail store with a presumptive case of blotchy bass syndrome. The collected swabs can be used to isolate DNA and RNA which can be used to identify pathogens including those associated with hyperpigmentation.

Technician at BSC
Photo of a technician working at a biological safety cabinet.
Photo of a technician working at a biological safety cabinet.

Primary leukocytes have been isolated from experimental fish
Primary leukocytes have been isolated from experimental fishFunctional and Molecular Bioassay Laboratory — Kearneysville, West Virginia. Multiwell cell culture array
Primary leukocytes have been isolated from experimental fish
Primary leukocytes have been isolated from experimental fishFunctional and Molecular Bioassay Laboratory — Kearneysville, West Virginia. Multiwell cell culture array
About the Research
The Functional and Molecular Bioassay Core Technology Team (CTT) as part of the Environmental Health Program utilizes reporter assays, quantitative gene expression analyses, and high-throughput sequencing methods to produce functional endpoints across a broad scope of environmental topics and sample matrices.
The Functional and Molecular Bioassay CTT applies and modifies microbial and eukaryotic reporter bioassays to detect the presence of bioactive chemicals in environmental water samples.
These analyses compliment analytical chemistry and biological datasets. Analyses include functional endpoints and quantitative gene expression analysis, utilizing both designed codesets and/or custom oligos. In the instance of insufficient genetic data for the non-model species of interest, the laboratory establishes in-house de novo sequence databases via high throughput sequencing methods. Bioassay capabilities were recently expanded by incorporating high content screening using a ImageExpress Pico. Methods adoption and development on this instrument include: functional immune assays previously run using microplates or flow cytometry, genetically engineered translocation-based assay to evaluate nuclear receptor binding, and cytotoxicity-based endpoints.
Key Analytical Capabilities
- Bioassay screening for genotoxic, mutagenic and endocrine active compounds
- In vitro screening and molecular/ functional response profiling of cultured cells
- Automated cell imaging and High Content Screening
- Functional genomics, quantitative gene expression analysis (quantitative polymerase chain reaction [qPCR] or digital, absolute copy measurements)
- Identification of biomarker genes in non-model organisms
- Virus discovery
Key Instrumentation
- Multimode plate reader for bioassay end-point measurements and ELISA
- nCounter Max (Nanostring) for multiplex, digital, gene expression analysis
- QX200 Droplet Digital PCR System
- QuantStudio 5 Real-Time PCR System
- High throughput sequencing (MiSeq)
- Image analysis-based flow cytometric analysis for functional cell assays
- ImageXpress Pico
- Extraction equipment for solid phase extraction of water samples
Environmental Health Integrated Science Team Collaborators
Environmental Health Integrated Science Team Collaborators
-
-
Drinking Water and Wastewater Infrastructure Science Team
The team studies toxicants and pathogens in water resources from their sources, through watersheds, aquifers, and infrastructure to human and wildlife exposures. That information is used to develop decision tools that protect human and wildlife health. -
Immunomodulation Science Team
The Immunomodulation Integrated Science Team focuses on contaminant and pathogen exposures in the environment that might influence the immune systems of wildlife and the connection to their shared environment with humans. In collaboration with public-health officials, the Team also addresses potential human-health risks stemming from similar exposures. If actual risks are identified, this Team... -
Energy Resources Life Cycle Integrated Science Team
The Energy Resources Life Cycle Integrated Science Team focuses on the potential for environmental contaminant exposures that might originate from energy resource activities including extraction, production, transportation, storage, waste management, and restoration. Perceived health risks to humans and other organisms will be distinguished from actual risks, if any. If actual risks are identified... -
Food Resources Lifecycle Integrated Science Team
The team studies the movement of toxicants and pathogens that could originate from the growing, raising, and processing/manufacturing of plant and animal products through the environment where exposure can occur. This information is used to understand if there are adverse effects upon exposure and to develop decision tools to protect health. -
Fishing, Hunting and Subsistence Living Integrated Science Team
The Fishing, Hunting, and Subsistence Living Integrated Science Team focuses on contaminant and pathogen exposures in the environment that could impact the presence and vitality of fish and wildlife populations that drive commercial, recreational and subsistence activities such as hunting and fishing. If actual risks are identified this project will inform how to economically and effectively...
Science activities related to the Functional and Molecular Bioassay Core Technology Team can be found below.
Agricultural best management practices can improve water quality and conditions for fisheries in the Chesapeake Bay Watershed
Issue Partners in the Chesapeake Bay Program (CBP) are implementing best management practices (BMPs) to prevent nutrient and sediment from entering waterways across the Chesapeake watershed and reduce loads to the Bay. In addition to reducing nutrients, CBP partners want to better understand how BMPs can provide additional benefits for addressing toxic contaminants, such as pesticides, hormones...
Fish and Aquatic Animal Health Publications, 2021 – 2022
Below are journal articles about fish and aquatic animal health from the Eastern Ecological Science Center published in 2021 and 2022.
Human and Ecological Health Impacts Associated with Water Reuse and Conservation Practices
Human and Ecological Health Impacts Associated with Water Reuse and Conservation Practices
Endocrine Disrupting Chemicals and Prevalence of Intersex in Fish Populations in New Jersey
Endocrine disrupting chemicals (EDCs) are compounds with the potential to interfere with normal endocrine communication in organisms.
Prevalence of novel, emerging hepatitis viruses in wild white suckers and their association with liver tumors in the Great Lakes region
Prevalence of novel, emerging hepatitis viruses in wild white suckers and their association with liver tumors in the Great Lakes region
Endocrine Disrupting Chemicals and Prevalence of Intersex in Fish Populations in New Jersey
NJ WSC and Leetown Science Center scientists in cooperation with the New Jersey Department of Environmental Protection were tasked with characterizing endocrine disruption in smallmouth bass from New Jersey.
Multimedia items related to the Functional and Molecular Bioassay Core Technology Team can be found below.
EESC Microplate Reader
a view of a laptop computer connected to 2 monitors and a microplate reader. The monitors display data generated from an assay including a standard curve.
a view of a laptop computer connected to 2 monitors and a microplate reader. The monitors display data generated from an assay including a standard curve.
Bioassay Dilution Gradient
Overhead view of a microplate with a dilution gradient. The targeted bioassay is designed to identify bioreactivity at varying concentrations.
Overhead view of a microplate with a dilution gradient. The targeted bioassay is designed to identify bioreactivity at varying concentrations.
nCounterMax Automated Prep Station
image of the automated prep station for the Nanostring nCounter Max. The device prepares cartridges for CodeSet Gene Expression Analysis
image of the automated prep station for the Nanostring nCounter Max. The device prepares cartridges for CodeSet Gene Expression Analysis
C. Raines Blotchy Bass Swab
Clay Raines, a USGS scientist, performing a dermal swab on a Largemouth Bass at a Bass Pro Shops retail store with a presumptive case of blotchy bass syndrome. The collected swabs can be used to isolate DNA and RNA which can be used to identify pathogens including those associated with hyperpigmentation.
Clay Raines, a USGS scientist, performing a dermal swab on a Largemouth Bass at a Bass Pro Shops retail store with a presumptive case of blotchy bass syndrome. The collected swabs can be used to isolate DNA and RNA which can be used to identify pathogens including those associated with hyperpigmentation.
Technician at BSC
Photo of a technician working at a biological safety cabinet.
Photo of a technician working at a biological safety cabinet.
Primary leukocytes have been isolated from experimental fish
Primary leukocytes have been isolated from experimental fishFunctional and Molecular Bioassay Laboratory — Kearneysville, West Virginia. Multiwell cell culture array
Primary leukocytes have been isolated from experimental fish
Primary leukocytes have been isolated from experimental fishFunctional and Molecular Bioassay Laboratory — Kearneysville, West Virginia. Multiwell cell culture array