
Mohawk River at Lock 9 at Rotterdam Junction, NY
Images
Images below come from a wide variety of USGS science activities in the Northeast Region. Science Center staff showcase what we do, who we are, and where we work conducting science that inform decision makers and addresses societal needs.
Filter Total Items: 2050

Mohawk River at Lock 9 at Rotterdam Junction, NY
Mohawk River at Lock 9 at Rotterdam Junction, NY

Mohawk River at Vischer Ferry Dam, NY
Mohawk RIver at Vischer Ferry Dam Ice Jam camera
Mohawk RIver at Vischer Ferry Dam Ice Jam camera

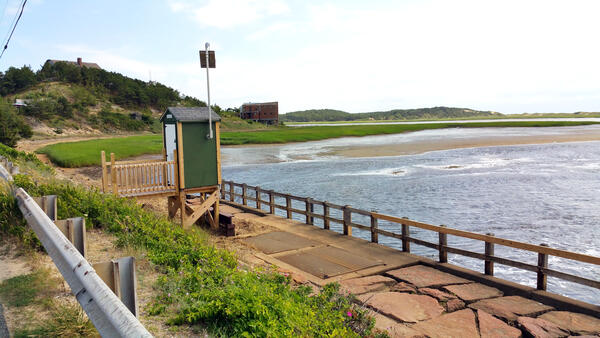
Tidal water moving through a tide control structure in Wellfleet, Massachusetts
Tidal water moving through a tide control structure in Wellfleet, MassachusettsA gage on the backside of a tide control structure on the Herring River at Chequessett Neck Rd at Wellfleet, Massachusetts. It is evident to see the movement of incoming tide in this picture. Data was collected at this site for several years prior to the removal of the dike in 2023.


Yellow Creek near Oak Grove, IN - Winter
Yellow Creek near Oak Grove, IN - Winter

Preparing for fieldwork in Florida Bay
Conducting field work after Hurricane Irma on Bob Allen Key in Florida Bay, Everglades National Park, January 29, 2018. Lynn Wingard (left) and Miriam Jones (right) consult field notes from 2014 to decide where to take samples. Photo: B. Stackhouse, USGS
Conducting field work after Hurricane Irma on Bob Allen Key in Florida Bay, Everglades National Park, January 29, 2018. Lynn Wingard (left) and Miriam Jones (right) consult field notes from 2014 to decide where to take samples. Photo: B. Stackhouse, USGS

Seismic Collage
Image showing a collage of examples of multi-channel and single-channel seismic data collected by the USGS, seismic equipment deployed from a research vessel, and seismic equipment on a research vessel. These data are critical to the CMG Program as they define the geology in marine and coastal environments.
Image showing a collage of examples of multi-channel and single-channel seismic data collected by the USGS, seismic equipment deployed from a research vessel, and seismic equipment on a research vessel. These data are critical to the CMG Program as they define the geology in marine and coastal environments.

Piping Plover Habitat, Cedar Island
The beach-dependent shorebirds project at the Woods Hole Coastal and Marine Science Center models current and future habitat availability for nesting shorebirds in an effort to map current and likely future habitat availability on a range of sites along the U.S. Atlantic coast.
The beach-dependent shorebirds project at the Woods Hole Coastal and Marine Science Center models current and future habitat availability for nesting shorebirds in an effort to map current and likely future habitat availability on a range of sites along the U.S. Atlantic coast.

Map of the Martha’s Vineyard and Nantucket study sites outlined in red
Map of the Martha’s Vineyard and Nantucket study sites outlined in redMap of the Martha’s Vineyard and Nantucket study sites outlined in red.
Map of the Martha’s Vineyard and Nantucket study sites outlined in red
Map of the Martha’s Vineyard and Nantucket study sites outlined in redMap of the Martha’s Vineyard and Nantucket study sites outlined in red.

Map of Massachusetts and the Islands
Study site map for the Massachusetts Shoreline Change Project, 2018 Update: A GIS Compilation of Shoreline Change Rates Calculated Using Digital Shoreline Analysis System Version 5.0, With Supplementary Intersects and Baselines for Massachusetts
Study site map for the Massachusetts Shoreline Change Project, 2018 Update: A GIS Compilation of Shoreline Change Rates Calculated Using Digital Shoreline Analysis System Version 5.0, With Supplementary Intersects and Baselines for Massachusetts

Cuyahoga River at Independence OH - view from edge of river
Cuyahoga River at Independence OH - view from edge of riverCuyahoga River at Independence OH - view from edge of river
Cuyahoga River at Independence OH - view from edge of river
Cuyahoga River at Independence OH - view from edge of riverCuyahoga River at Independence OH - view from edge of river

Florida Bay at Sunset, 2018
After a long day collecting cores, the team of scientists watch the sun set over the Florida Bay.
After a long day collecting cores, the team of scientists watch the sun set over the Florida Bay.

Elevation data for land and submerged areas, Barnegat Bay, NJ
Elevation data for land and submerged areas, Barnegat Bay, NJCoastal storms can severely alter the topography and ecosystems along heavily populated coastal regions. Seamless integrated elevation data for both land and submerged areas in Barnegat Bay, New Jersey, are fundamental to coastal planning of the northeastern U.S. Atlantic coast.

Diver in cave
Cave passage and diver (Bil Philips, cave explorer) in Ox Bel Ha Cave System of the northeastern Yucatan Peninsula.
Cave passage and diver (Bil Philips, cave explorer) in Ox Bel Ha Cave System of the northeastern Yucatan Peninsula.
Storm and sea level rise scenario model for Dauphin Island, Alabama
Storm and sea level rise scenario model for Dauphin Island, AlabamaStorm and sea level rise scenario models, like the one shown here, can be used to explore the future. This model shows what Dauphin Island may look like 10 years from now if storms become stronger and more frequent (Passeri and others, 2018).

USGS station 011058798, Herring River at Chequessett Neck Road dike, downstream
USGS station 011058798, Herring River at Chequessett Neck Road dike, downstreamUSGS Station 011058798, Herring River at Chequessett Neck Road dike, looking downstream.
USGS station 011058798, Herring River at Chequessett Neck Road dike, downstream
USGS station 011058798, Herring River at Chequessett Neck Road dike, downstreamUSGS Station 011058798, Herring River at Chequessett Neck Road dike, looking downstream.

Thawing Permafrost, Alaska
Thawing permafrost on various peatlands in Alaska. Permafrost thaw results in ground subsidence and inundation that kills black spruce and other understory plants living on the permafrost plateau. The black spruce forests found on permafrost plateaus are replaced with sedge- and moss-dominated bogs and fens, altering the ecosystem structure and function.
Thawing permafrost on various peatlands in Alaska. Permafrost thaw results in ground subsidence and inundation that kills black spruce and other understory plants living on the permafrost plateau. The black spruce forests found on permafrost plateaus are replaced with sedge- and moss-dominated bogs and fens, altering the ecosystem structure and function.

Mangroves Surrounding a Playa, Florida Bay 2018
Mangroves on the outside of a playa within Florida Bay.
Mangroves on the outside of a playa within Florida Bay.

SEABOSS Collage
SEABed Observation and Sampling System (SEABOSS) (center image) and the MiniSEABOSS (right) designed for rapid, inexpensive, and effective collection of seabed imagery (photographs and video) as well sediment samples from the coastal/inner-continental shelf regions.
SEABed Observation and Sampling System (SEABOSS) (center image) and the MiniSEABOSS (right) designed for rapid, inexpensive, and effective collection of seabed imagery (photographs and video) as well sediment samples from the coastal/inner-continental shelf regions.

UAS pilots at Kilauea
Department of Interior UAS pilots from left to right – Elizabeth Pendleton (USGS, Woods Hole, MA), Colin Milone (Office of Aviation Services, AK), John Vogel (USGS; Flagstaff, AZ), Sandy Brosnahan (USGS, Woods Hole, MA), Brandon Forbes (USGS; Tucson, AZ), Chris Holmquist-Johnson (USGS; Fort Collins, CO),&nb
Department of Interior UAS pilots from left to right – Elizabeth Pendleton (USGS, Woods Hole, MA), Colin Milone (Office of Aviation Services, AK), John Vogel (USGS; Flagstaff, AZ), Sandy Brosnahan (USGS, Woods Hole, MA), Brandon Forbes (USGS; Tucson, AZ), Chris Holmquist-Johnson (USGS; Fort Collins, CO),&nb