
USGS staffer in Susquehanna River floodwaters in Owego, NY 2011
Images
Images below come from a wide variety of USGS science activities in the Northeast Region. Science Center staff showcase what we do, who we are, and where we work conducting science that inform decision makers and addresses societal needs.
Filter Total Items: 2050

Susquehanna Floodwaters in Owego, NY 2011
USGS staffer in Susquehanna River floodwaters in Owego, NY 2011

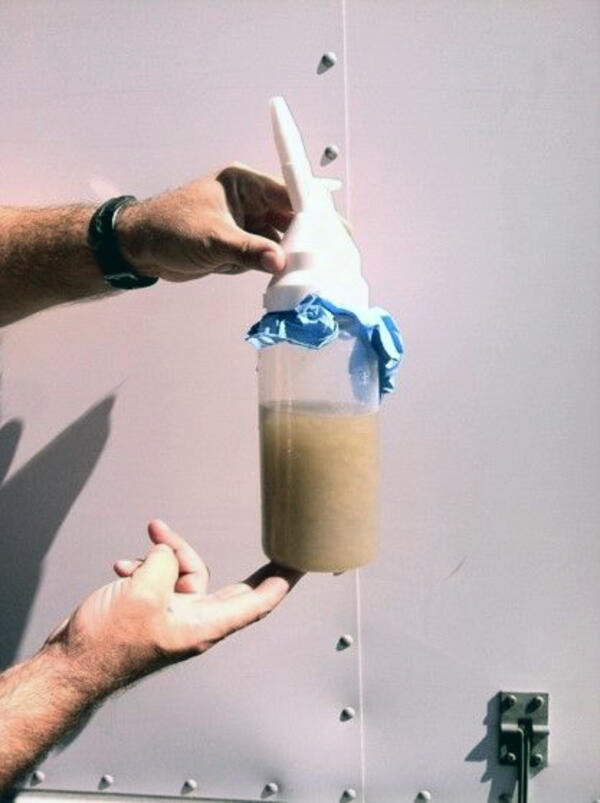
USGS scientists test the moving arm bottom platform
USGS scientists test the moving arm bottom platformUSGS scientists test the moving arm bottom platform at the Woods Hole Oceanographic Institution (WHOI) dock. While it was deployed, the system moved sensors through the bottom boundary layer and transmitted data in real time to shore via WHOI's Martha's Vineyard coastal observatory.

USGS scientists assembling a novel profiling arm
USGS scientists assembling a novel profiling arm to measure suspended sediment in the benthic boundary layer. This large seafloor platform was later deployed for several months off Martha's Vineyard, MA as part of the Optics Acoustics and Stress In Situ (OASIS) Project in 2011.
USGS scientists assembling a novel profiling arm to measure suspended sediment in the benthic boundary layer. This large seafloor platform was later deployed for several months off Martha's Vineyard, MA as part of the Optics Acoustics and Stress In Situ (OASIS) Project in 2011.

USGS Flag Flying on the Masthead of CCGS Louis S. St-Laurent near 880 N, Arctic Ocean
USGS Flag Flying on the Masthead of CCGS Louis S. St-Laurent near 880 N, Arctic OceanNice photo-opportunity of USGS working near the North Pole!
USGS Flag Flying on the Masthead of CCGS Louis S. St-Laurent near 880 N, Arctic Ocean
USGS Flag Flying on the Masthead of CCGS Louis S. St-Laurent near 880 N, Arctic OceanNice photo-opportunity of USGS working near the North Pole!
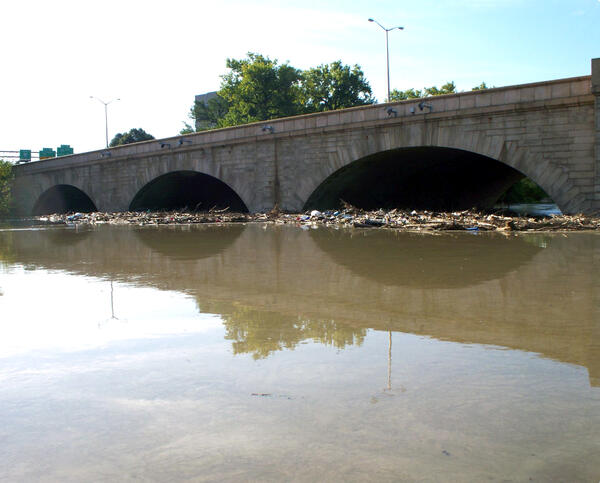
Debris jam from flooding after Tropical Strom Irene
Debris jam from flooding after Tropical Strom IreneDebris jam from flooding after Tropical Strom Irene on the upstream side of the Bulkeley Bridge in Hartford, CT.
Debris jam from flooding after Tropical Strom Irene
Debris jam from flooding after Tropical Strom IreneDebris jam from flooding after Tropical Strom Irene on the upstream side of the Bulkeley Bridge in Hartford, CT.
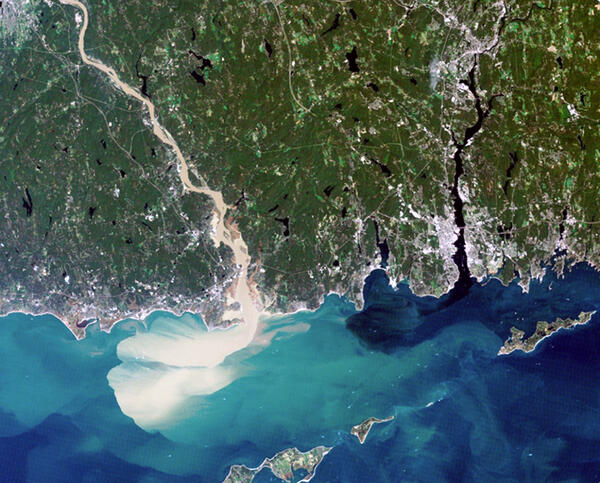
Satellite imagery showing the Connecticut River sediment
Satellite imagery showing the Connecticut River sedimentSatellite imagery of southern Connecticut showing the Connecticut River and the Thames River, with the Connecticut River a muddy color due to heavy sediment transport.
Satellite imagery showing the Connecticut River sediment
Satellite imagery showing the Connecticut River sedimentSatellite imagery of southern Connecticut showing the Connecticut River and the Thames River, with the Connecticut River a muddy color due to heavy sediment transport.

Reconstruction of channel at Roaring Brook after Irene
Reconstruction of channel at Roaring Brook after IreneThe channel at Roaring Brook needed reconstruction after Irene devastated the river system due to the immense rainfall. This image was taken looking upstream from Route 7 (North St) crossing in Bennington, Vermont.

Flooded parking lot along the Connecticut River
Before Irene reached New England, the USGS New England Water Science Center had to make sure our boats were running properly in anticipation of making discharge measurements in the larger rivers. In some cases, we had to get permission ahead of time to use boat ramps that were closed to the public.
Before Irene reached New England, the USGS New England Water Science Center had to make sure our boats were running properly in anticipation of making discharge measurements in the larger rivers. In some cases, we had to get permission ahead of time to use boat ramps that were closed to the public.

Damage to bridge at E. Kill nr Jewett from Tropical Storm Irene
Damage to bridge at E. Kill nr Jewett from Tropical Storm IreneDamage to bridge at E. Kill nr Jewett from Tropical Storm Irene
Damage to bridge at E. Kill nr Jewett from Tropical Storm Irene
Damage to bridge at E. Kill nr Jewett from Tropical Storm IreneDamage to bridge at E. Kill nr Jewett from Tropical Storm Irene

Parking lot in Guilford, Connecticut destroyed after Irene
Parking lot in Guilford, Connecticut destroyed after IreneThis photo taken on August 30, 2011 shows what used to be the parking lot where we parked our field vehicle during a previous deployment. The rocks in the forefront used to be part of the paved parking lot that was largely destroyed during Irene.

USCGC Healy in Heavy Ice Passing CCGS Louis S. St-Laurent
USCGC Healy in Heavy Ice Passing CCGS Louis S. St-LaurentUSCG Healy is circling to pass CCGS Louis in order to break her free from the ice. The joint field program utilized two icebreakers so that the seismic vessel, with gear in the water behind the ship, could be broken free when the ice prevented her forward progress.

Airgun array deployment
Deploying the airgun array from CCGS Louis S. St-Laurent. USCGC Healy can be seen in the background.
Deploying the airgun array from CCGS Louis S. St-Laurent. USCGC Healy can be seen in the background.

Ice Breaker
CCGS Louis S. St-Laurent following the path created by USCGC Healy
CCGS Louis S. St-Laurent following the path created by USCGC Healy

High-Water Mark found at undesirable location after Irene
High-Water Mark found at undesirable location after IreneA High-Water Mark (HWM) at USGS station ID 01150900 Ottauquechee River at West Bridgewater, Vermont was observed at an undesirable location. It was inside the gage house and above the equipment, which was destroyed!

White River flooded Route 14 near West Hartford, VT
White River flooded Route 14 near West Hartford, VTThis photograph of the White River near West Hartford, Vermont (USGS station ID 01144000, gage on the left) was taken on August 29, 2011 and is looking upstream towards the USGS gage.
White River flooded Route 14 near West Hartford, VT
White River flooded Route 14 near West Hartford, VTThis photograph of the White River near West Hartford, Vermont (USGS station ID 01144000, gage on the left) was taken on August 29, 2011 and is looking upstream towards the USGS gage.
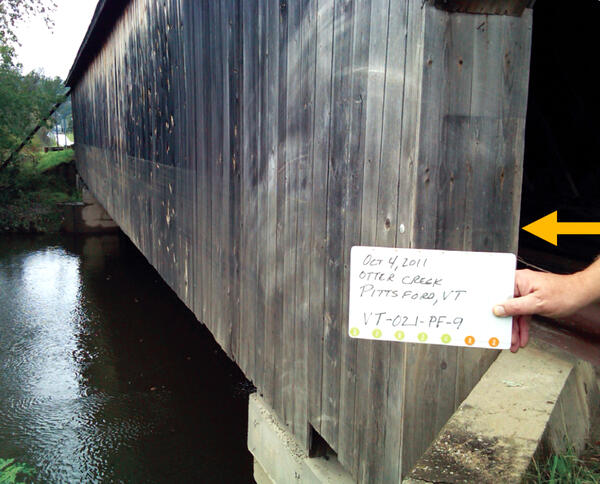
Covered bridge showing a high-water mark from Tropical Storm Irene
Covered bridge showing a high-water mark from Tropical Storm IreneCovered bridge over Otter Creek showing a high-water mark (silt line) from Tropical Storm Irene.
Covered bridge showing a high-water mark from Tropical Storm Irene
Covered bridge showing a high-water mark from Tropical Storm IreneCovered bridge over Otter Creek showing a high-water mark (silt line) from Tropical Storm Irene.

Cohoes Waterfalls during Tropical Storm Irene
Cohoes Falls in Cohoes, NY following Tropical Storm Irene
Cohoes Falls in Cohoes, NY following Tropical Storm Irene

USCGC Healy, Circling and Passing by the Stern of CCGS Louis S. St-Laurent
USCGC Healy, Circling and Passing by the Stern of CCGS Louis S. St-LaurentUSCG Healy is circling to pass CCGS Louis in order to break her free from the ice. The joint field program utilized two icebreakers so that the seismic vessel, with gear in the water behind the ship, could be broken free when the ice prevented her forward progress.

Tropical Storm Irene floodwaters damage Route 14 in Vermont
Tropical Storm Irene floodwaters damage Route 14 in VermontUSGS station ID 01144000 White River near West Hartford, Vermont. Rainfall from Irene led to flooding throughout New England including here where floodwaters damaged Route 14. Note the debris line on the bridge rail, which is the river’s peak from the storm!

Road and bridge damage at USGS Station ID 01150900 Ottauquechee River
Road and bridge damage at USGS Station ID 01150900 Ottauquechee RiverUSGS station ID 01150900 Ottauquechee River at West Bridgewater, Vermont. Bridge and road damage was substantial throughout New England due to the intense rainfall. Amazingly, the USGS gage survived the storm!