
LCMAP Change Stories
Sequoias Under Siege
Phosphate Mining in Florida's Bone Valley
Washaway Beach
Disney World
Palm Springs, CA
Click the "Science" links below to see how we track change over time.
Every pixel tells a story.
That’s because a Landsat pixel is more than a speck of satellite data. It’s a piece of ground on planet Earth. Ground that changes with the seasons, through the years, through assault by rapid disaster or the slow churn of natural cycles. Cities grow. Forests burn, then return. Lakes and rivers swell and shift.
The work of the USGS Land Change Monitoring, Assessment, and Projection (LCMAP) initiative takes place with this understanding top of mind. Its datasets use Landsat information to follow the land cover and change story of every pixel in the conterminous United States, year by year, from 1985 on.
In doing so, LCMAP data products open the door to a deeper understanding of our nation. Its deep time series approach also offers guidance to satellite-based land cover science, helping the research community to improve land cover mapping for the entire planet.
LCMAP Change Stories are designed to offer a small window into the wealth of possible inquiry made possible by the initiative’s approach to land cover mapping.
Follow the “Science” links below to explore these stories. You’ll see the impact of hurricanes and tornadoes, urban sprawl and industrial expansion, landslides and erosion, and much more. Check back for more stories as the months pass, and be sure to follow USGS EROS on Twitter, Facebook, and Instagram for news and updates.
Related
Follow the links to see each LCMAP Change Story

LCMAP Change Stories: Outfitting the Ozarks LCMAP Change Stories: Outfitting the Ozarks

LCMAP Change Stories: Where the Forests Fall, the Grasses Grow LCMAP Change Stories: Where the Forests Fall, the Grasses Grow

LCMAP Change Stories: Crops Give Way to Concrete LCMAP Change Stories: Crops Give Way to Concrete

LCMAP Change Stories: Where the Ocean Eats the Land LCMAP Change Stories: Where the Ocean Eats the Land
LCMAP Change Stories: Building a Boomtown, Block by Block

LCMAP Change Stories: Gone in 60 Seconds
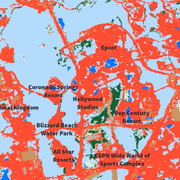
LCMAP Change Stories: It's a Sprawl World After All

LCMAP Change Stories: Hurricanes in the Everglades

LCMAP Change Stories: Alabama Tornadoes
Related
Follow the links to see each LCMAP Change Story
LCMAP Change Stories: Outfitting the Ozarks LCMAP Change Stories: Outfitting the Ozarks
LCMAP Change Stories: Where the Forests Fall, the Grasses Grow LCMAP Change Stories: Where the Forests Fall, the Grasses Grow
LCMAP Change Stories: Crops Give Way to Concrete LCMAP Change Stories: Crops Give Way to Concrete
LCMAP Change Stories: Where the Ocean Eats the Land LCMAP Change Stories: Where the Ocean Eats the Land
LCMAP Change Stories: Building a Boomtown, Block by Block
LCMAP Change Stories: Gone in 60 Seconds
LCMAP Change Stories: It's a Sprawl World After All
LCMAP Change Stories: Hurricanes in the Everglades