
USGS scientists collect data for a landscape genetics study in the sagebrush of the Great Basin.
Images
Explore images.
Filter Total Items: 698

Scientists collecting data in Idaho sagebrush
USGS scientists collect data for a landscape genetics study in the sagebrush of the Great Basin.

PCMSC research vessel Parke Snavely on Nisqually Reach
PCMSC research vessel Parke Snavely on Nisqually ReachUSGS Pacific Coastal and Marine Science Center’s research vessel R/V Parke Snavely motors on the Nisqually Reach of Puget Sound.
PCMSC research vessel Parke Snavely on Nisqually Reach
PCMSC research vessel Parke Snavely on Nisqually ReachUSGS Pacific Coastal and Marine Science Center’s research vessel R/V Parke Snavely motors on the Nisqually Reach of Puget Sound.

Eruptions in the Cascade Range during the past 4000 years. USGS GIP 64
Eruptions in the Cascade Range during the past 4000 years. USGS GIP 64Eruptions in the Cascade Range during the past 4000 years. USGS GIP 64
Eruptions in the Cascade Range during the past 4000 years. USGS GIP 64
Eruptions in the Cascade Range during the past 4000 years. USGS GIP 64Eruptions in the Cascade Range during the past 4000 years. USGS GIP 64

Sunrise on Pompey Peak, Washington
Sunrise on Pompey Peak, Washington.

Specific Pathogen-Free (SPF) Pacific herring
Specific Pathogen-Free (SPF) Pacific herring reared in the wet laboratory at the Marrowstone Marine Field Station.
Specific Pathogen-Free (SPF) Pacific herring reared in the wet laboratory at the Marrowstone Marine Field Station.

Adult Oregon spotted frog
Adult Oregon spotted frog at Dilman Meadows, near Wickiup Reservoir, OR
Adult Oregon spotted frog at Dilman Meadows, near Wickiup Reservoir, OR

Dye tracer study on the Kootenai River
Aerial view of a USGS dye tracer study done on the Kootenai River in Idaho.
Aerial view of a USGS dye tracer study done on the Kootenai River in Idaho.

Panorama of Hailey, Idaho
Panoramic photograph of Hailey, Idaho, looking southeast from Carbonate Mountain.
Panoramic photograph of Hailey, Idaho, looking southeast from Carbonate Mountain.

Landscape in Washington state with forest, mountain, and houses
Landscape in Washington state with forest, mountain, and housesA landscape photograph of a valley with a mountain in the background. The valley consists of forests and residential housing.
Landscape in Washington state with forest, mountain, and houses
Landscape in Washington state with forest, mountain, and housesA landscape photograph of a valley with a mountain in the background. The valley consists of forests and residential housing.
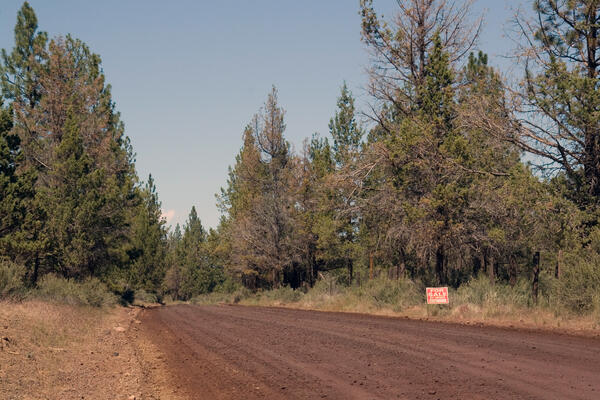
A pine forest with a dirt road running through it in Oregon
A pine forest with a dirt road running through it in OregonA pine forest with a dirt road running through it in Oregon. Photo taken as a part of field work during the Land Cover Trends project.
A pine forest with a dirt road running through it in Oregon
A pine forest with a dirt road running through it in OregonA pine forest with a dirt road running through it in Oregon. Photo taken as a part of field work during the Land Cover Trends project.

Researcher collects particle size analysis samples
Researcher collects particle size analysis samplesGary Barton (USGS) collects particle size analysis samples of the surface riverbed material of the Kootenai River about three miles upstream from Bonners Ferry, ID.
Researcher collects particle size analysis samples
Researcher collects particle size analysis samplesGary Barton (USGS) collects particle size analysis samples of the surface riverbed material of the Kootenai River about three miles upstream from Bonners Ferry, ID.

An elk grazes in Yellowstone National Park.

Broken Top volcano, inactive since 150 ka or longer, viewed to NW. ...
Broken Top volcano, inactive since 150 ka or longer, viewed to NW. ...Radially dipping strata of the cone include subequal proportions of lava flows and flow breccias and of proximal agglutinate and scoria falls, nearly all having 54 to 56 percent SiO2. Numerous mafic dikes and sills intrude the cone, and an apron of compositionally similar mafic lavas extends far outward from the cone.

Subalpine meadow - Olympic Peninsula
Subalpine meadow near Deer Park campground on the Olympic Peninsula in Washington.
Subalpine meadow near Deer Park campground on the Olympic Peninsula in Washington.

Scientist observing Mount St. Helens' crater and dome
Scientist observing Mount St. Helens' crater and domeUSGS scientist observing Mount St. Helens' crater and dome from the Brutus Camera station.
Scientist observing Mount St. Helens' crater and dome
Scientist observing Mount St. Helens' crater and domeUSGS scientist observing Mount St. Helens' crater and dome from the Brutus Camera station.

Investigation and disease prevention of Spring Viremia of Carp Virus
Investigation and disease prevention of Spring Viremia of Carp VirusTypical clinical signs of SVC disease, exopthalmia and abdominal distension with hemorrhaging seen in a virus-exposed fathead minnow.
Investigation and disease prevention of Spring Viremia of Carp Virus
Investigation and disease prevention of Spring Viremia of Carp VirusTypical clinical signs of SVC disease, exopthalmia and abdominal distension with hemorrhaging seen in a virus-exposed fathead minnow.

Mount Adams western profile as seen from Mount St. Helens.
Mount Adams western profile as seen from Mount St. Helens.Mount Adams western profile as seen from Mount St. Helens.
Mount Adams western profile as seen from Mount St. Helens.
Mount Adams western profile as seen from Mount St. Helens.Mount Adams western profile as seen from Mount St. Helens.

Figure 1. Appearance of Descaling Site Exposed to Fast Green FCF Dye
Figure 1. Appearance of Descaling Site Exposed to Fast Green FCF DyeFigure 1. Appearance of descaling site exposed to fast green FCF dye six hours after intentional descaling injury, showing loss of scales and presence of fast green staining. Areas of unintentional integumental injury are also stained (arrows).
Related image Figure 2.

Figure 2. Scanning Electron Micrograph of Descaling Area
Figure 2. Scanning Electron Micrograph of Descaling AreaFigure 2. Scanning electron micrograph of descaling area delimited by box in Figure 1 showing epidermal disruption, empty scale pockets and an exposed scale with visible concentric ridges (upper right). Scale bar = 500 µm.

Figure 3. Appearance of Descaling Site Exposed to Fast Green FCF Dye
Figure 3. Appearance of Descaling Site Exposed to Fast Green FCF DyeFigure 3. Appearance of descaling site exposed to fast green FCF dye 96 hours after intentional descaling injury, showing lack of scales, presence of fast green staining in areas of epidermal disruption and absence of staining in areas where migrating epidermal cells have closed the wound.

Figure 4. Scanning Electron Micrograph of Descaling Area
Figure 4. Scanning Electron Micrograph of Descaling AreaFigure 4. Scanning electron micrograph of descaling area delimited by box in Figure 3 showing epidermal disruption (arrows), empty scale pockets and restoration of epidermal integrity (asterisk). An exposed scale with visible concentric ridges is visible at the lower center. Scale bar = 500 µm.