
Hydrograph of the USGS 01379845 Rockaway River at Warren St at Dover with camera images showing how the Ice changs the stage at the site
Images
Images intro.
Filter Total Items: 289
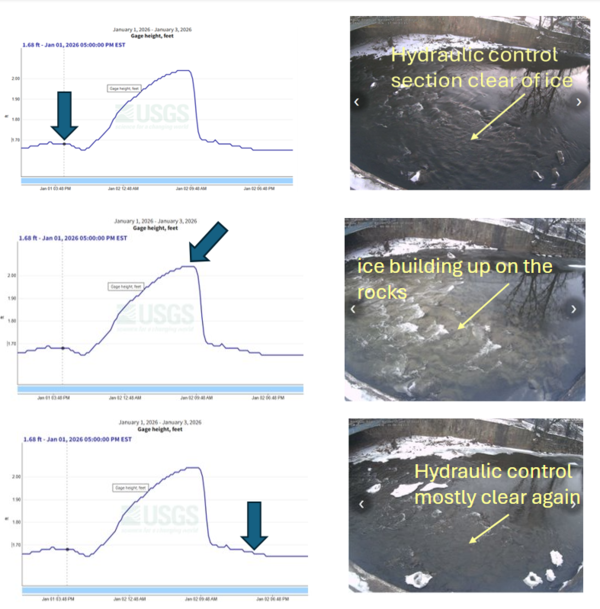
Ice Impact on the Rockaway River
Hydrograph of the USGS 01379845 Rockaway River at Warren St at Dover with camera images showing how the Ice changs the stage at the site

Jersey Current Newsletter
View of New Hope New Jersey from across the river at the USGS 01462000 Delaware River at Lambertville, New Jersey site
View of New Hope New Jersey from across the river at the USGS 01462000 Delaware River at Lambertville, New Jersey site
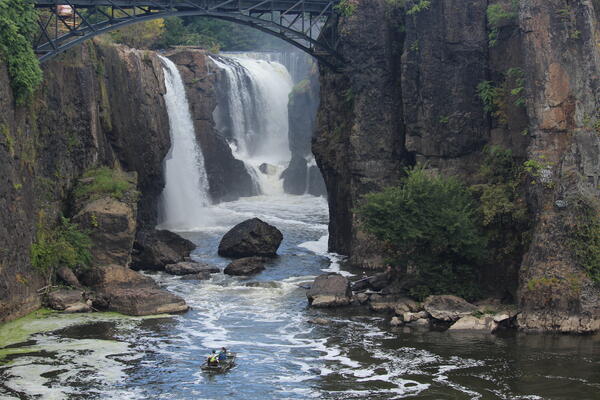
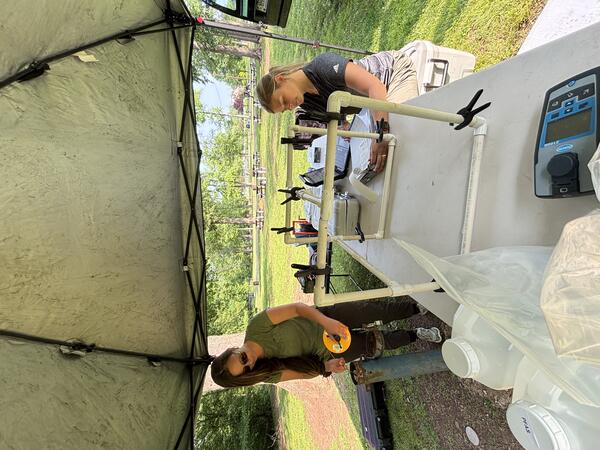
Members of the NJWSC, EPA, and NPS, conducted a sampling event for PFAS in foam at the Paterson Great Falls National Historic Park in Paterson, NJ
Members of the NJWSC, EPA, and NPS, conducted a sampling event for PFAS in foam at the Paterson Great Falls National Historic Park in Paterson, NJMembers of the NJWSC, EPA, and NPS, conducted a sampling event for PFAS in foam at the Paterson Great Falls National Historic Park in Paterson, NJ.
Summer 2025 Photo Contest Winner: Jacob Gray, Where We Work category
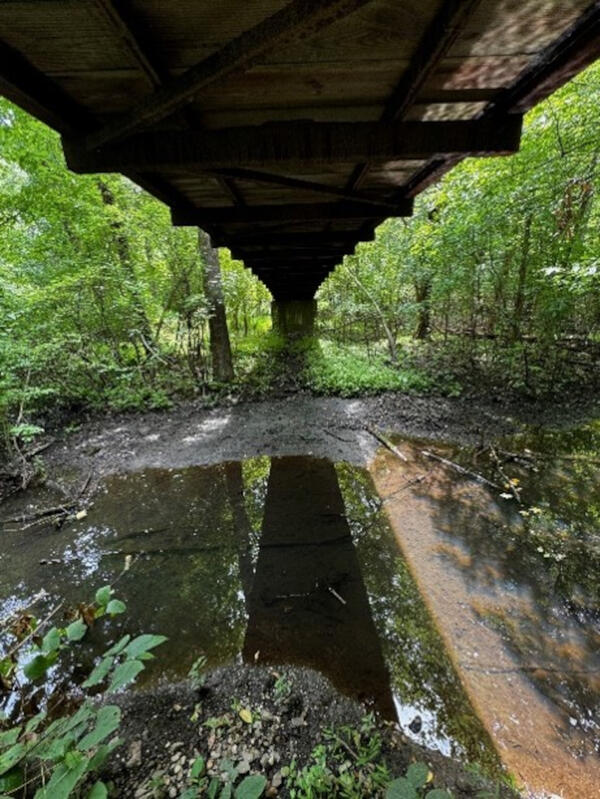
Timber Swamp Brook
River flowing over a small control under a bridge at the site USGS 01407970 Timber Swamp Brook at Farmingdale, New Jersey
River flowing over a small control under a bridge at the site USGS 01407970 Timber Swamp Brook at Farmingdale, New Jersey
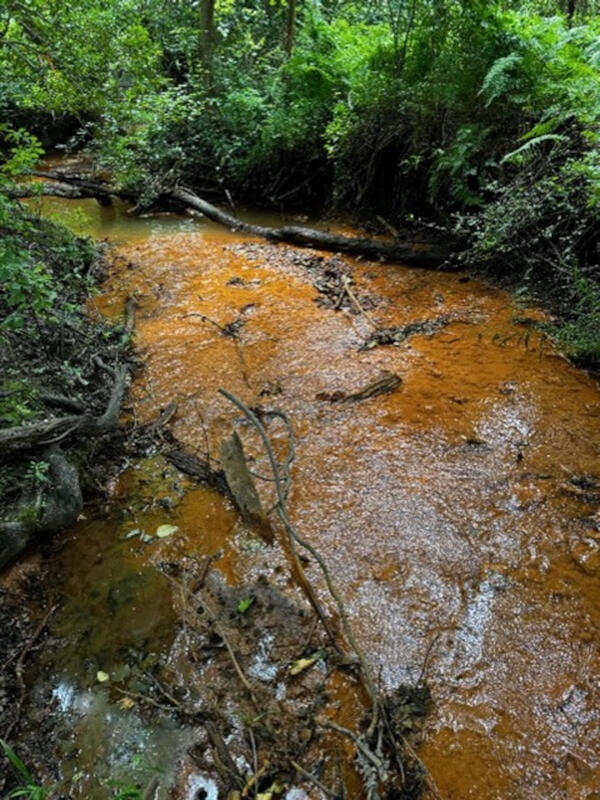
Ardena Brook
Project sampling location scouted for site USGS 01407877 Ardena Brook at Ardena, New Jersey
Project sampling location scouted for site USGS 01407877 Ardena Brook at Ardena, New Jersey
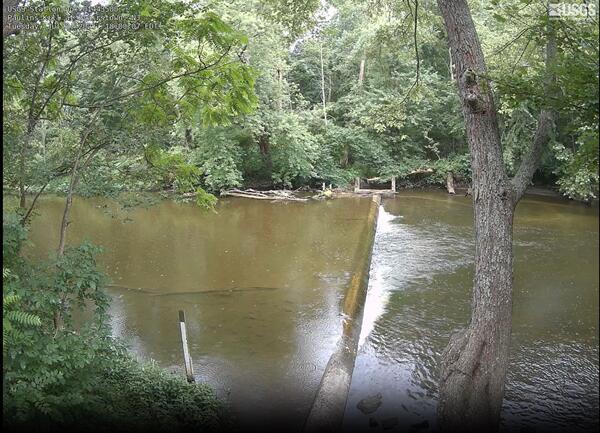
Blairstown Webcam
Looking across the weir at the gaging point for the USGS 01443500 Paulins Kill at Blairstown, New Jersey site.
Looking across the weir at the gaging point for the USGS 01443500 Paulins Kill at Blairstown, New Jersey site.
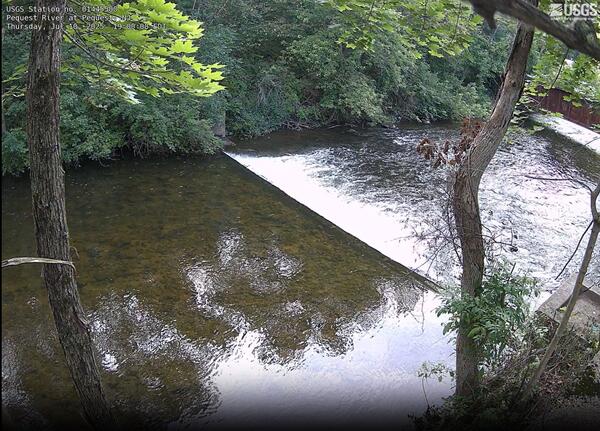
Pequest Webcam
Looking out on the Pequest river from above the gage house at USGS 01445500 Pequest River at Pequest, New Jersey
Looking out on the Pequest river from above the gage house at USGS 01445500 Pequest River at Pequest, New Jersey
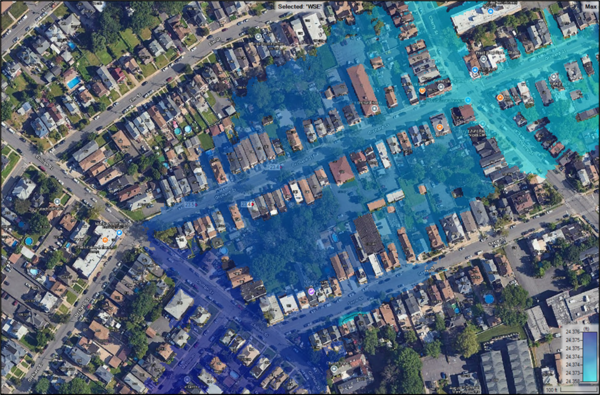
Elizabeth Flooding Simulation
Screen capture displaying areas of inundation within the City of Elizabeth for a flood event generated from a Flood Inundation Mapper.
Screen capture displaying areas of inundation within the City of Elizabeth for a flood event generated from a Flood Inundation Mapper.
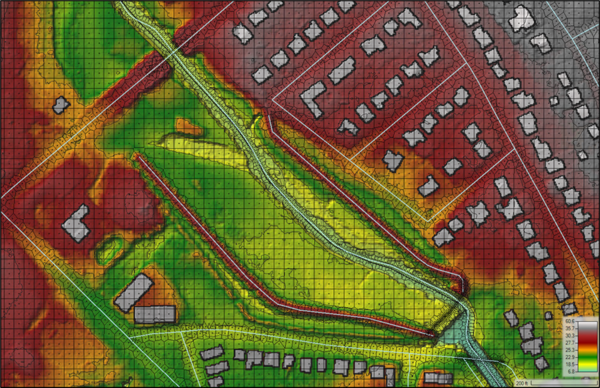
Hydraulic Model Sample of Elizabeth
Sample area of two-dimensional hydraulic model showing two-dimensional model mesh and underlying digital elevation model (DEM).
Sample area of two-dimensional hydraulic model showing two-dimensional model mesh and underlying digital elevation model (DEM).
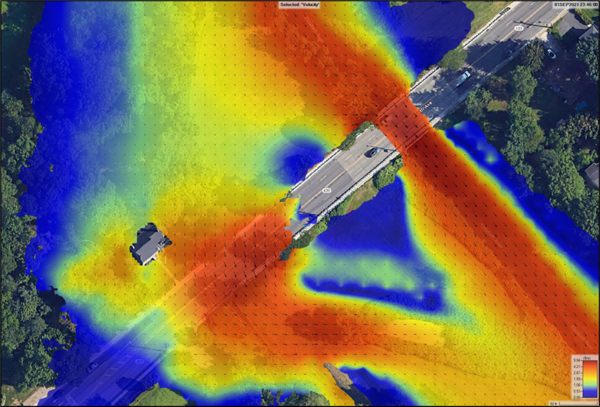
Stream Velocity Simulation
HEC-RAS two-dimensional simulation screen capture demonstrating simulated stream velocities and streamflow during a large flood peak along the Elizabeth River.
HEC-RAS two-dimensional simulation screen capture demonstrating simulated stream velocities and streamflow during a large flood peak along the Elizabeth River.
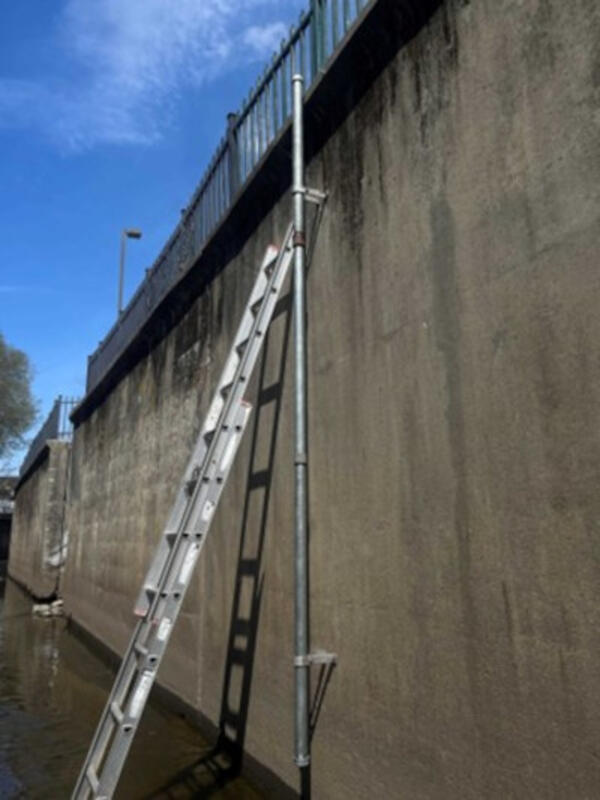
Westfield Ave Crest-Stage Gage
Calibration crest-stage gage installed at Westfield Avenue within the City of Elizabeth.
Calibration crest-stage gage installed at Westfield Avenue within the City of Elizabeth.
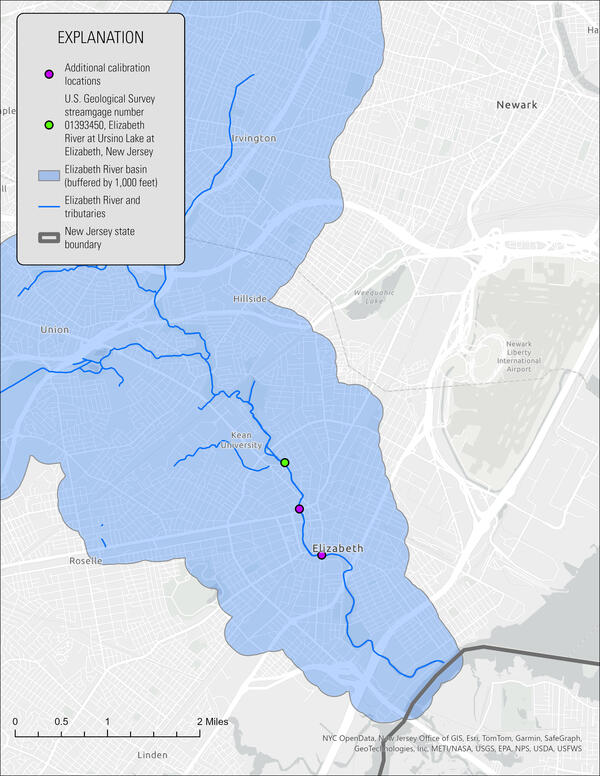
Elizabeth River Basin
Map of the City of Elizabeth and surrounding areas depicting the Elizabeth River and its tributaries with study sites and the USGS 01393450 Elizabeth River at Ursino Lake at Elizabeth, New Jersey station
Map of the City of Elizabeth and surrounding areas depicting the Elizabeth River and its tributaries with study sites and the USGS 01393450 Elizabeth River at Ursino Lake at Elizabeth, New Jersey station
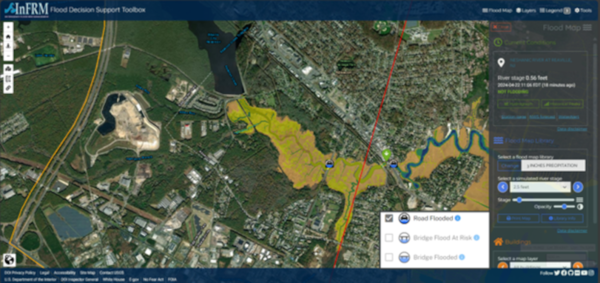
Flood Inundation Map of Elizabeth
Screen capture showing the New Jersey Flood Decision Support Toolbox Application.
Screen capture showing the New Jersey Flood Decision Support Toolbox Application.
Groundwater sampling tent
USGS Scientists Kate Bowen and Nicole White extract water samples from groundwater well 403300074202901 MW134A Edison Twp and prepare them for transport to the National Laboratory for examination.
USGS Scientists Kate Bowen and Nicole White extract water samples from groundwater well 403300074202901 MW134A Edison Twp and prepare them for transport to the National Laboratory for examination.
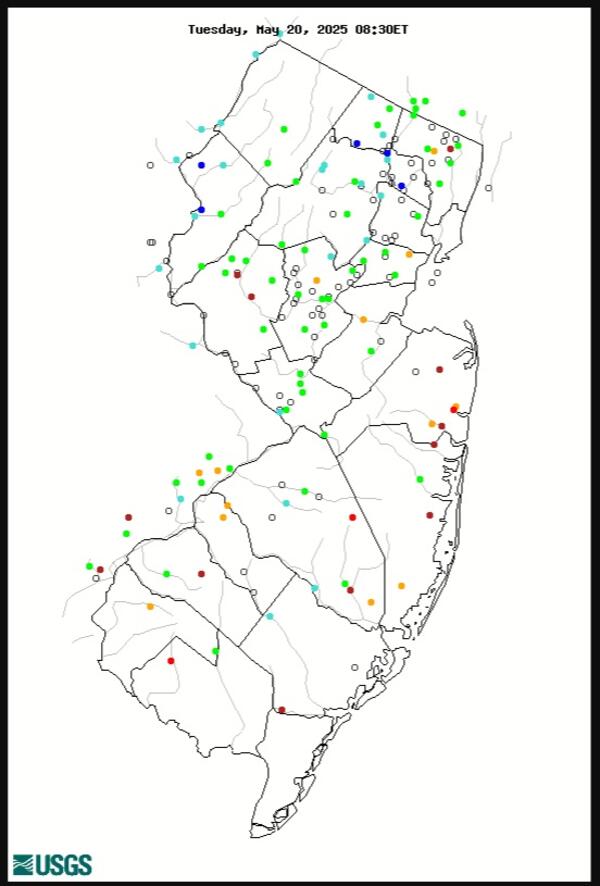
WaterWatch NJ
Map of real-time streamflow compared to historical streamflow for the 20th of May 2025, New Jersey
Map of real-time streamflow compared to historical streamflow for the 20th of May 2025, New Jersey
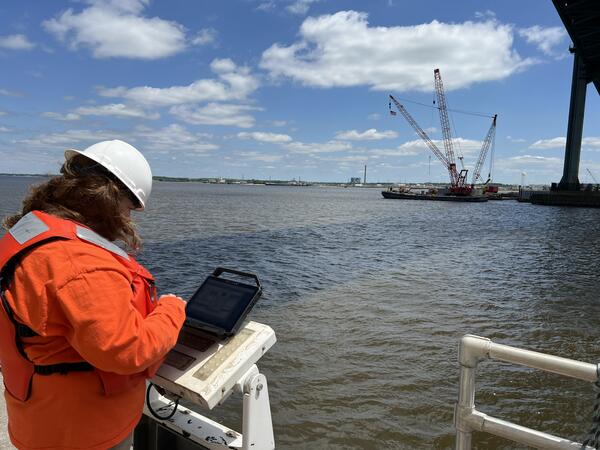
Delaware Memorial Bridge Science
USGS scientist Sally Carullo downloading data from the sensors mounted on the USGS 01482100 Delaware River at Del Mem Bridge at Wilmington, Delaware.
USGS scientist Sally Carullo downloading data from the sensors mounted on the USGS 01482100 Delaware River at Del Mem Bridge at Wilmington, Delaware.

Weston Mills Webcam
Looking out upon the Lawrence Brook from across the Weston Mills Water Company facility yard, at the 01405030 Lawrence Brook at Weston Mills, New Jersey site.
Looking out upon the Lawrence Brook from across the Weston Mills Water Company facility yard, at the 01405030 Lawrence Brook at Weston Mills, New Jersey site.
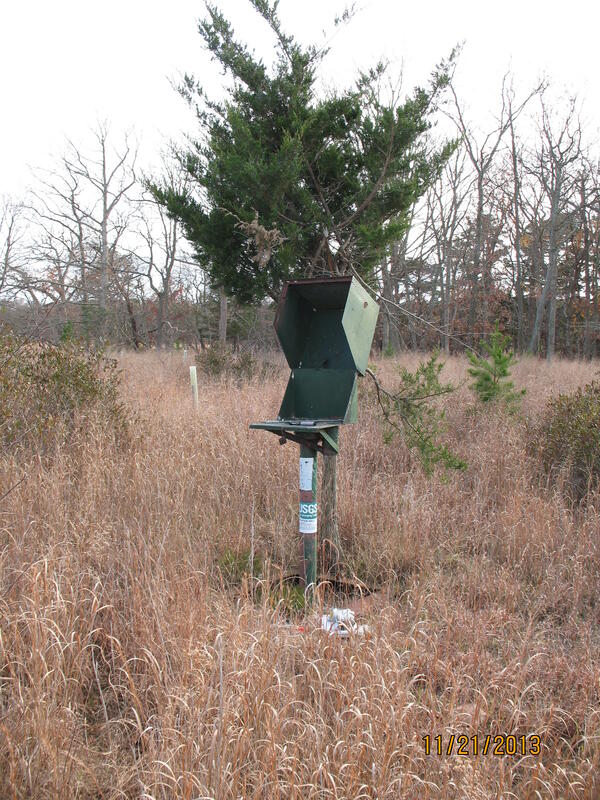
Groundwater Well
USGS New Jersey Groundwater well housing at 395028074104401 DOE-Forked River Obs in Forked River, New Jersey
USGS New Jersey Groundwater well housing at 395028074104401 DOE-Forked River Obs in Forked River, New Jersey

Tuckerton Tide Gage
USGS 01409335 Little Egg Inlet near Tuckerton, New Jersey tide gage

Tide Gage Storm Hardening
Two labeled images showing the changes made to tide gages to make them more resistant to hurricane damage, so that they can continue to provide accurate data in harsh, storm-conditions.
Two labeled images showing the changes made to tide gages to make them more resistant to hurricane damage, so that they can continue to provide accurate data in harsh, storm-conditions.

Tidal Elevation Surveys
Survey level transit at USGS 01409124 Barnegat Bay at Waretown, New Jersey tide gage site
Survey level transit at USGS 01409124 Barnegat Bay at Waretown, New Jersey tide gage site