
Looking out on the control for the USGA 01464000 Assunpink Creek at Trenton, New Jersey under the Monmouth Street Bridge
Images
Images intro.
Filter Total Items: 297
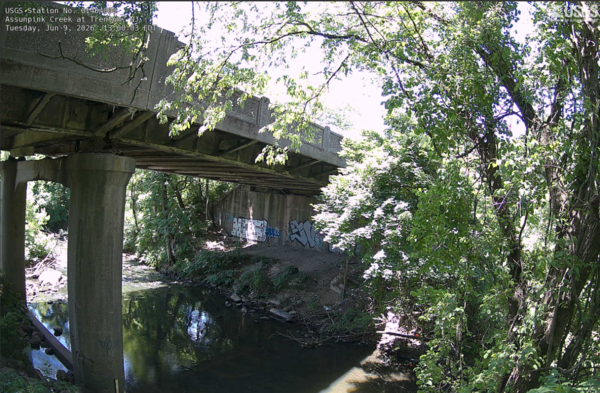
Assunpink Webcam
Looking out on the control for the USGA 01464000 Assunpink Creek at Trenton, New Jersey under the Monmouth Street Bridge
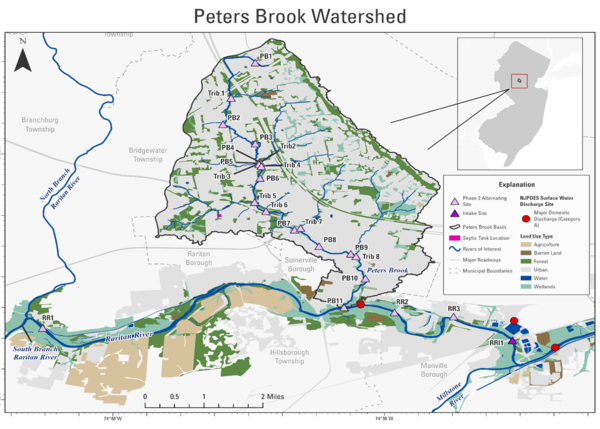
Peters Brook Watershed
Phase 2 low-to-normal flow sampling locations within Peters Brook watershed and Raritan Mainstem
Phase 2 low-to-normal flow sampling locations within Peters Brook watershed and Raritan Mainstem
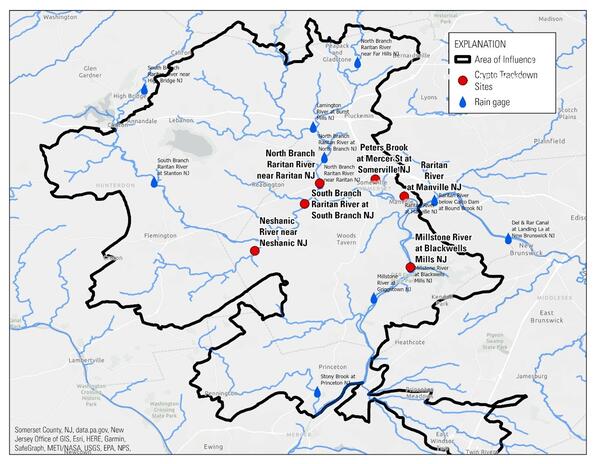
Map of Crypto Study
Phase 1 low-to-normal and storm flow sampling locations and rain gages, as well as area of influence location.
Phase 1 low-to-normal and storm flow sampling locations and rain gages, as well as area of influence location.
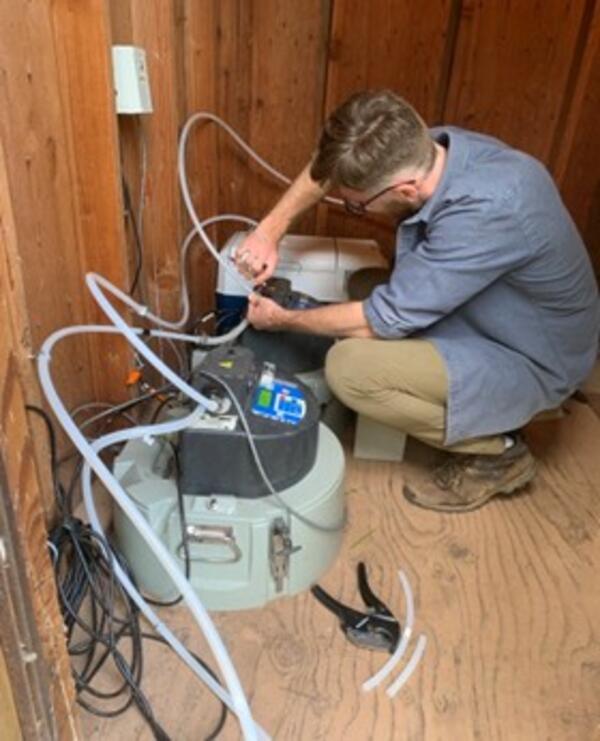
Setting up Storm Sampler
USGS Hydrographer Lucas Sirotniak setting up storm sampling equipment that was stored within trailers at most study sites.
USGS Hydrographer Lucas Sirotniak setting up storm sampling equipment that was stored within trailers at most study sites.
Saltwater Inundation Study Area Map
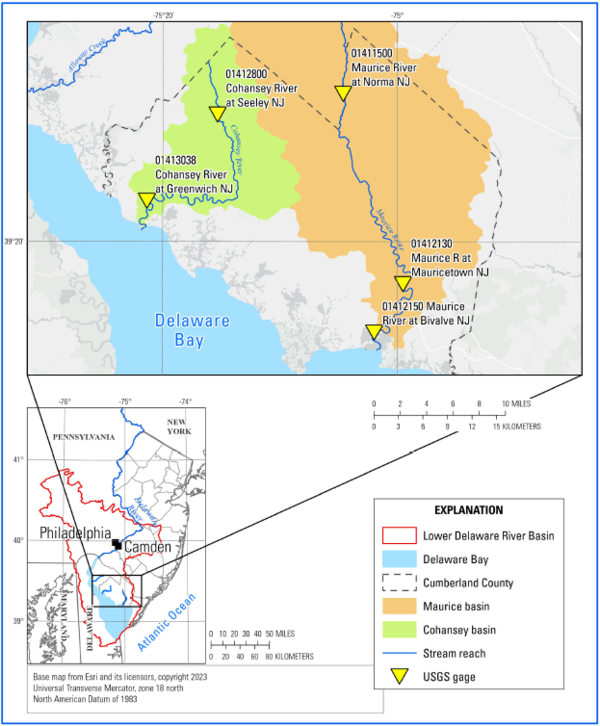
Map showing the lower Delaware River basin, Cumberland County, New Jersey, and locations of U.S. Geological Survey gages along the reaches of the Maurice and Cohansey Rivers.
Map showing the lower Delaware River basin, Cumberland County, New Jersey, and locations of U.S. Geological Survey gages along the reaches of the Maurice and Cohansey Rivers.
Maurice River RMs
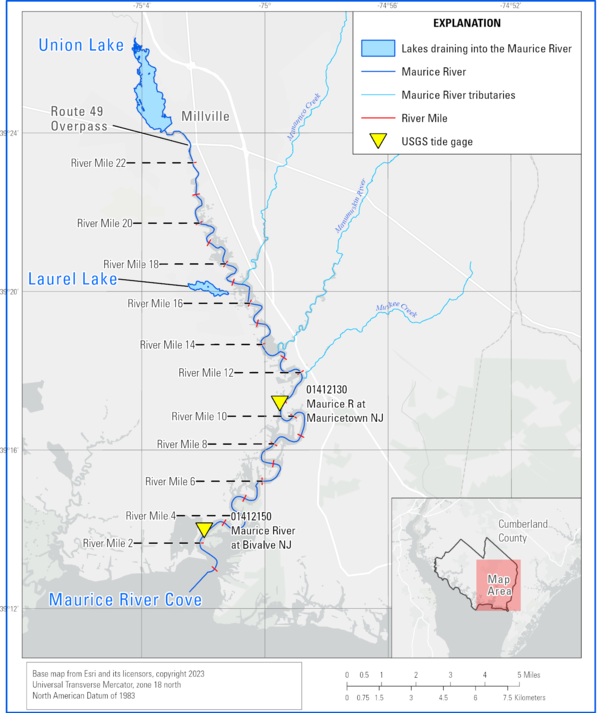
Map showing a close-up view of the Maurice River, river miles measured from the mouth, and U.S. Geological Survey gages used in the study.
Map showing a close-up view of the Maurice River, river miles measured from the mouth, and U.S. Geological Survey gages used in the study.
Montague Ice Stream Profile
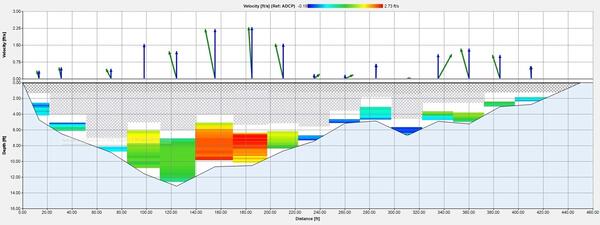
Output images from the collected data of the Acoustic Doppler Current Profiler used for the ice measurement at USGS 01438500 Delaware River at Montague, New Jersey.
Output images from the collected data of the Acoustic Doppler Current Profiler used for the ice measurement at USGS 01438500 Delaware River at Montague, New Jersey.
Delaware Ice Plot
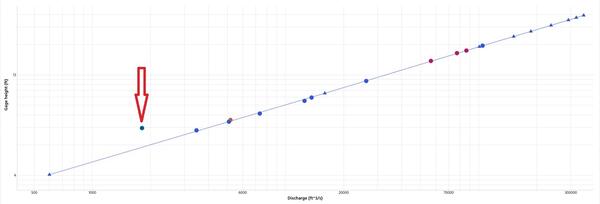
Image of the rating curve for 01438500 Delaware River at Montague, NJ, showing how the ice measurement compares to other measurements and expected flows at the site
Image of the rating curve for 01438500 Delaware River at Montague, NJ, showing how the ice measurement compares to other measurements and expected flows at the site
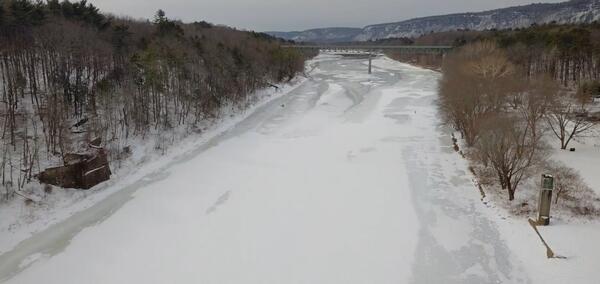
Montague Bridge Ice
Looking downstream along the frozen river at the Montague bridge and the USGS 01438500 Delaware River at Montague, New Jersey site
Looking downstream along the frozen river at the Montague bridge and the USGS 01438500 Delaware River at Montague, New Jersey site
Delaware Ice Boreholes
Aerial view of the Boreholes drilled in the ice to measure the flow at the USGS site 01438500 Delaware River at Montague, New Jersey
Aerial view of the Boreholes drilled in the ice to measure the flow at the USGS site 01438500 Delaware River at Montague, New Jersey
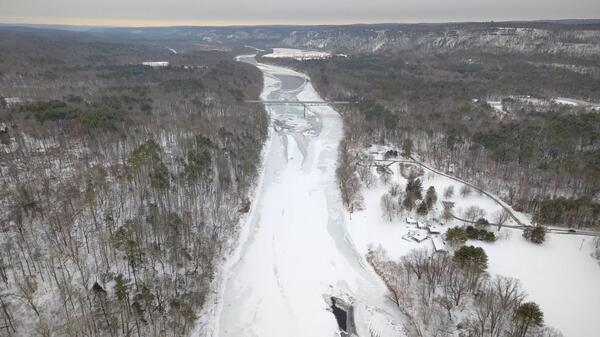
A frozen view of the Delaware
Looking out over the frozen Delaware River at the Montague Gage house on the right and the bridge in the distance downstream at the USGS 01438500 Delaware River at Montague site before the ice measurement is made
Looking out over the frozen Delaware River at the Montague Gage house on the right and the bridge in the distance downstream at the USGS 01438500 Delaware River at Montague site before the ice measurement is made
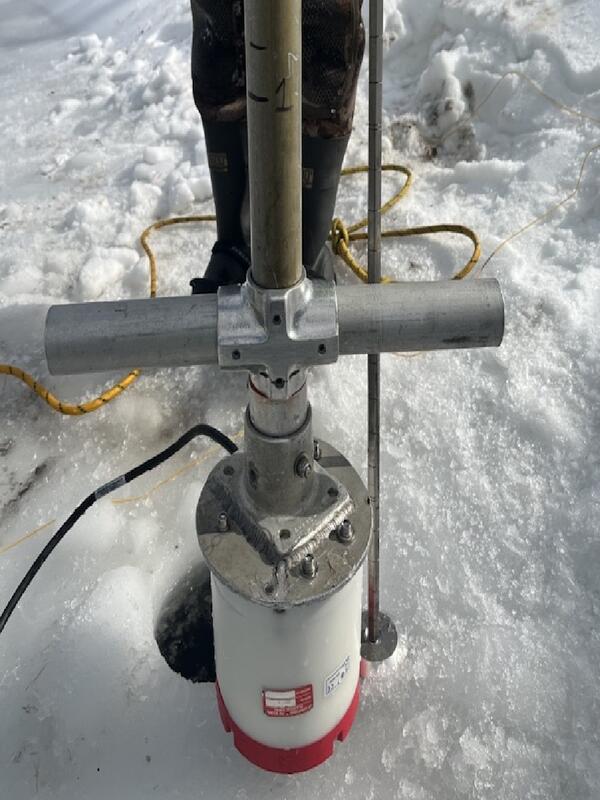
Delaware Ice Measurement Sensor
Looking at the Acoustic Dopler Current Profiler (ADCP) being used to measure the flow below the ice next to a traditional wading rod inn front of the borehole in in the ice at USGS 01438500 Delaware River at Montague, New Jersey
Looking at the Acoustic Dopler Current Profiler (ADCP) being used to measure the flow below the ice next to a traditional wading rod inn front of the borehole in in the ice at USGS 01438500 Delaware River at Montague, New Jersey
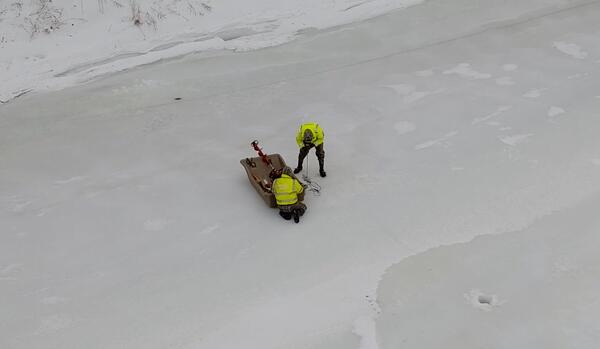
Delaware Ice Measurement Sampling
USGS scientists Patrick Bowen and Jon Suchy collecting flow data through a borehole in the ice at USGS 01438500 Delaware River at Montague, New Jersey
USGS scientists Patrick Bowen and Jon Suchy collecting flow data through a borehole in the ice at USGS 01438500 Delaware River at Montague, New Jersey
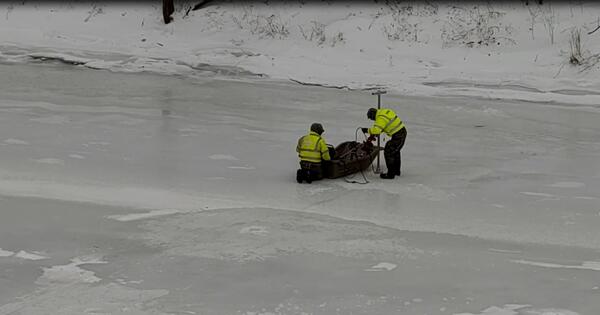
Montague Ice Measurement
USGS Scientists Jon Suchy and Pat Bowen working off of an ice sled, lower an acoustic sensor below the ice, through the hole they drilled to obtain flow information for the USGS 01438500 Delaware River at Montague, New Jersey site
USGS Scientists Jon Suchy and Pat Bowen working off of an ice sled, lower an acoustic sensor below the ice, through the hole they drilled to obtain flow information for the USGS 01438500 Delaware River at Montague, New Jersey site
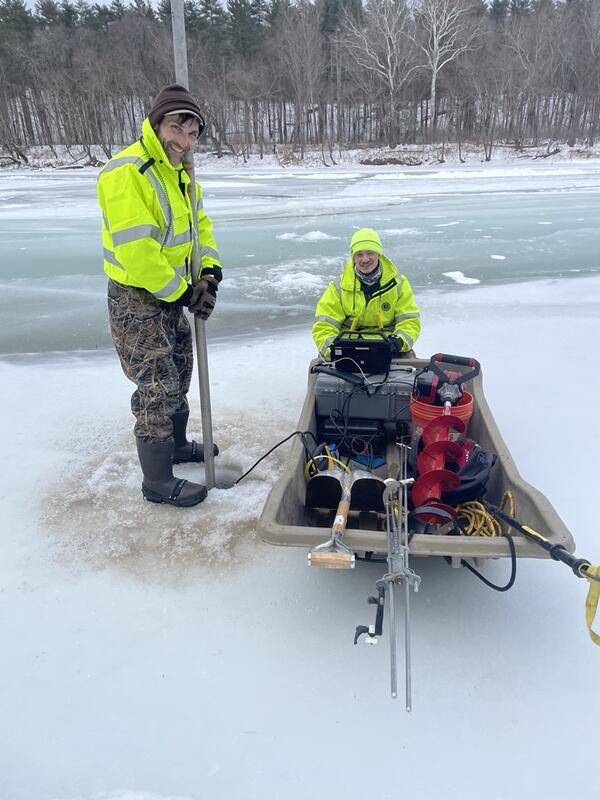
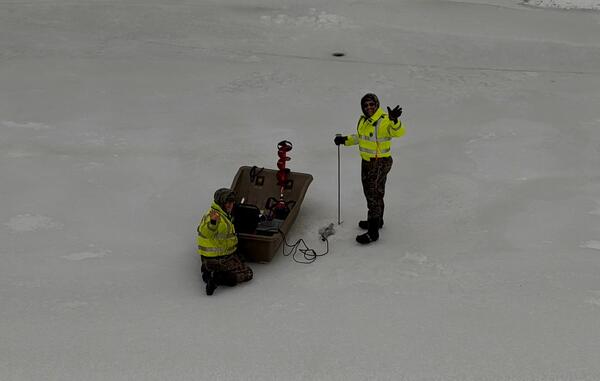
Montague Ice Sampling
USGS Scientist Jon Suchy collects and records data on a laptop while scientist Pat Bowen measures the thickness of the ice during their measurement of the flow under the ice at USGS 01438500 Delaware River at Montague, New Jersey
USGS Scientist Jon Suchy collects and records data on a laptop while scientist Pat Bowen measures the thickness of the ice during their measurement of the flow under the ice at USGS 01438500 Delaware River at Montague, New Jersey
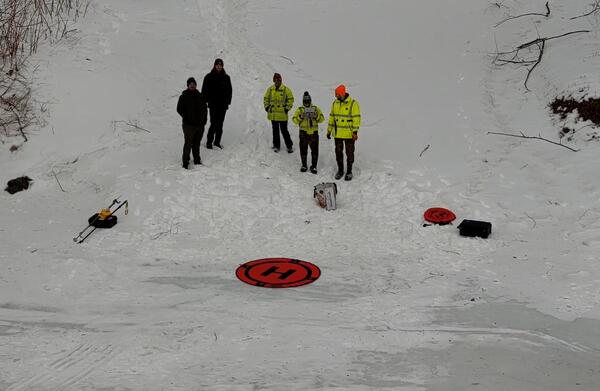
New Jersey UAS Team at Work
New Jersey Unmanned Aerial Systems (UAS) Team along with two observers bringing their drone back to shore after filming the USGS scientists out on the river making a measurement of flow below the ice at USGS 01438500 Delaware River at Montague, New Jersey
New Jersey Unmanned Aerial Systems (UAS) Team along with two observers bringing their drone back to shore after filming the USGS scientists out on the river making a measurement of flow below the ice at USGS 01438500 Delaware River at Montague, New Jersey
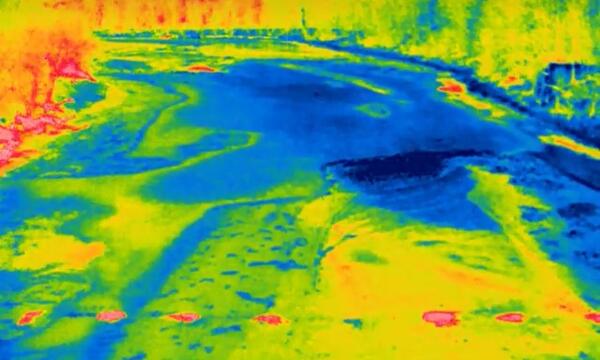
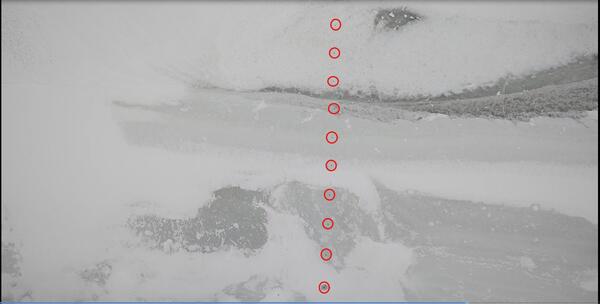
IR view of the ice work
Looking at the USGS 01483500 Delaware River at Montague, New Jersey through an Infra-red camera which shows the differences in the ice as shades of color. The red circles along the bottom are the boreholes where the warmer water below is exposed to the surface.
Looking at the USGS 01483500 Delaware River at Montague, New Jersey through an Infra-red camera which shows the differences in the ice as shades of color. The red circles along the bottom are the boreholes where the warmer water below is exposed to the surface.
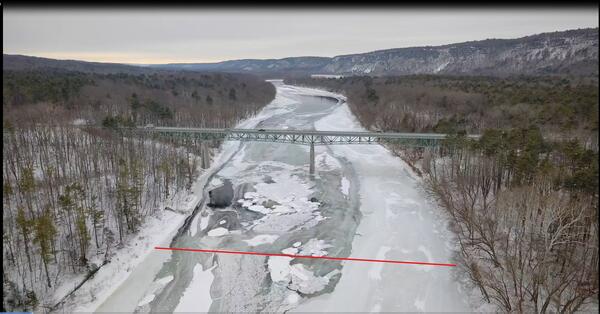
Delaware River Ice Cross-Section
Aerial view looking downstream at USGS site 01438500 Delaware River at Montague, New Jersey and seeing the bridge over the frozen river with a red highlighted line indicating the intended cross section for the ice measurement.
Aerial view looking downstream at USGS site 01438500 Delaware River at Montague, New Jersey and seeing the bridge over the frozen river with a red highlighted line indicating the intended cross section for the ice measurement.
Hello from the Delaware River
USGS scientists Jon Suchy and Pat Bowen take a moment to greet the drone watching them as they make a measurement of the flow under the ice at USGS 01438500 Delaware River at Montague, New Jersey
USGS scientists Jon Suchy and Pat Bowen take a moment to greet the drone watching them as they make a measurement of the flow under the ice at USGS 01438500 Delaware River at Montague, New Jersey
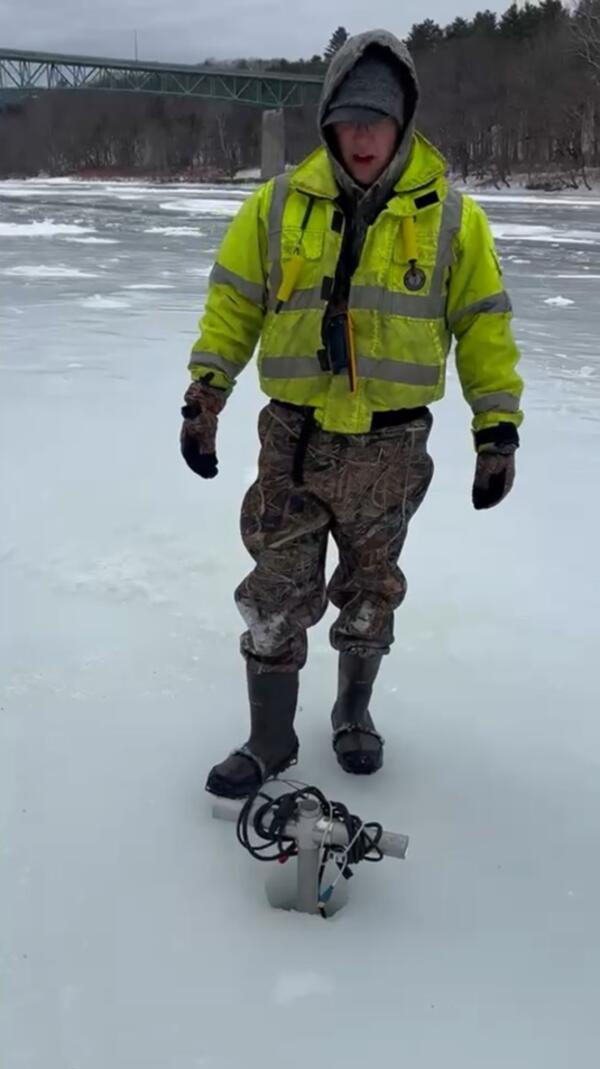
Montague Ice Probe
USGS Scientist Karl Braun lowers an Acoustic Probe below the ice to collect the flow data for the USGS 01438500 Delaware River at Montague, New Jersey site
USGS Scientist Karl Braun lowers an Acoustic Probe below the ice to collect the flow data for the USGS 01438500 Delaware River at Montague, New Jersey site
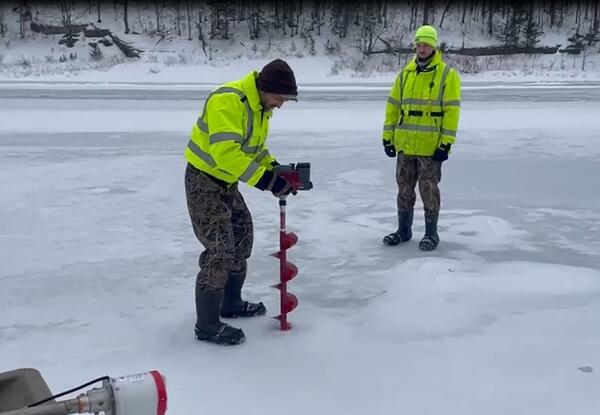
Montague Ice Drilling
USGS Scientists Patric Bowen and Jon Suchy drill a Borehole in the ice on the Delaware river at USGS 01438500 Delaware River at Montague, New Jersey
USGS Scientists Patric Bowen and Jon Suchy drill a Borehole in the ice on the Delaware river at USGS 01438500 Delaware River at Montague, New Jersey