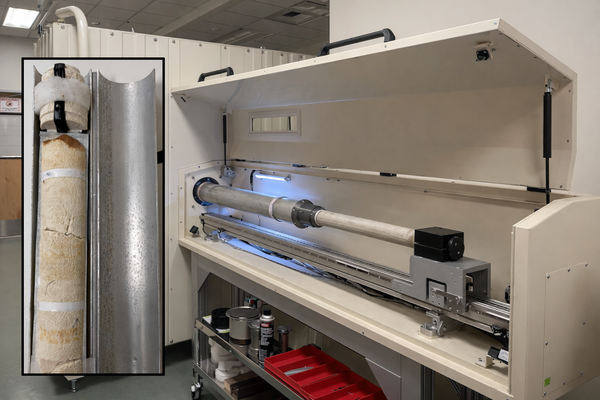
U.S. flag

An official website of the United States government

Multimedia

Images

Figure showing San Lorenzo River watershed on central California coast alongside a sediment rating curve
San Lorenzo River watershed on central California coast alongside a sediment rating curve

Figure shows (a) San Lorenzo River watershed, central California coast, which empties into Monterey Bay. Fluvial sediment sampling location is indicated just upstream of river mouth.

Figure shows (a) San Lorenzo River watershed, central California coast, which empties into Monterey Bay. Fluvial sediment sampling location is indicated just upstream of river mouth.

Figure showing north-to-south rupture simulations at the intersection of the South San Andreas Fault and a normal fault
North-to-south rupture simulations at the intersection of the South San Andreas Fault and a normal fault

North-to-south (N2S) rupture simulations with oblique (−45°; panels a–d) and left-lateral (0°; panels e–h) normal fault (NF) pre-stress. In the left column (panels a, b, e, and f), the San Andreas (SSAF) ends at the intersection with the NF, while in the right column (panels c, d, g, and h), the San Andreas (SSAF-EXT) “extends” south of the SSAF-NF intersection.

North-to-south (N2S) rupture simulations with oblique (−45°; panels a–d) and left-lateral (0°; panels e–h) normal fault (NF) pre-stress. In the left column (panels a, b, e, and f), the San Andreas (SSAF) ends at the intersection with the NF, while in the right column (panels c, d, g, and h), the San Andreas (SSAF-EXT) “extends” south of the SSAF-NF intersection.

Figure showing satellite image of China Camp marsh with model boundaries
Study location showing satellite image of China Camp marsh with model boundaries

Satellite image of China Camp marsh, with model boundaries from the Delft3D model shown with white lines and the observation points marked with red dots; red lines mark where x and y are 0. (b) Overview of San Francisco Bay, with a star marking China Camp marsh.

Satellite image of China Camp marsh, with model boundaries from the Delft3D model shown with white lines and the observation points marked with red dots; red lines mark where x and y are 0. (b) Overview of San Francisco Bay, with a star marking China Camp marsh.

Figure showing an example of calibration and validation of CoSMoS-COAST using historical satellite-derived shoreline data
Example of calibration and validation of CoSMoS-COAST using historical satellite-derived shoreline data

An example of calibration and validation of CoSMoS-COAST using historical satellite-derived shoreline data. The figure shows the extent of the CoSMoS-COAST U.S. South Atlantic Coast model transects (panel A—in green) with a zoomed in section of Cape Hatteras, North Carolina (panel B), which shows a close-up of the 50 m transect spacing (green lines).

An example of calibration and validation of CoSMoS-COAST using historical satellite-derived shoreline data. The figure shows the extent of the CoSMoS-COAST U.S. South Atlantic Coast model transects (panel A—in green) with a zoomed in section of Cape Hatteras, North Carolina (panel B), which shows a close-up of the 50 m transect spacing (green lines).

Figure shows study location, the reef-lined south coast of Moloka'i
Study location - reef-lined south coast of Moloka'i

Figure from the study "Hurricane wave energy dissipation and wave-driven currents over a fringing reef" showing the study location, the reef-lined south coast of Moloka'i.

Figure from the study "Hurricane wave energy dissipation and wave-driven currents over a fringing reef" showing the study location, the reef-lined south coast of Moloka'i.

Research Vessel Williams on a trailer, seen from the front

The USGS Research Vessel Williams is owned and operated by the Pacific Coastal and Marine Science Center.

The USGS Research Vessel Williams is owned and operated by the Pacific Coastal and Marine Science Center.

Videos

Cover image for the video "USGS Coastal and Marine Field Operations" showing montage of fieldwork USGS Coastal and Marine Field Operations
USGS Coastal and Marine Field Operations

To conduct the science needed to understand coastal and marine geohazards, support habitat and resource management, and monitor how these environments change over time, the USGS Coastal and Marine Hazards and Resources Program relies on engineering, mechanical, and electronics expertise for field operations along the coast, in the nearshore environment, and in the d

To conduct the science needed to understand coastal and marine geohazards, support habitat and resource management, and monitor how these environments change over time, the USGS Coastal and Marine Hazards and Resources Program relies on engineering, mechanical, and electronics expertise for field operations along the coast, in the nearshore environment, and in the d

Image of a deep-sea sulfide mound at Escanaba Trough with the text "Characterizing organic carbon at Escanaba Trough" Characterizing organic carbon at Escanaba Trough
Characterizing organic carbon at Escanaba Trough

The global ocean is a significant carbon sink, absorbing about a third of all atmospheric carbon dioxide (CO2) emissions (Gruber et al., 2019).

Image of a deep-sea sulfide mound at Escanaba Trough with the text "Characterizing organic carbon at Escanaba Trough" Characterizing organic carbon at Escanaba Trough (AD)
Characterizing organic carbon at Escanaba Trough (AD)

The global ocean is a significant carbon sink, absorbing about a third of all atmospheric carbon dioxide (CO2) emissions (Gruber et al., 2019).

Aerial image of a California beach with text reading "Shoreline Seasonality of California's Beaches" Shoreline Seasonality of California's Beaches
Shoreline Seasonality of California's Beaches

Most of the world’s beaches have regular cycles of erosion and recovery, but new USGS research is showing that these cycles may be considerably different from common perceptions. 

Most of the world’s beaches have regular cycles of erosion and recovery, but new USGS research is showing that these cycles may be considerably different from common perceptions. 

Aerial image of a California beach with text reading "Shoreline Seasonality of California's Beaches" Shoreline Seasonality of California's Beaches (AD)
Shoreline Seasonality of California's Beaches (AD)

Most of the world’s beaches have regular cycles of erosion and recovery, but new USGS research is showing that these cycles may be considerably different from common perceptions. 

Most of the world’s beaches have regular cycles of erosion and recovery, but new USGS research is showing that these cycles may be considerably different from common perceptions. 

Coral on a cinderblock and a scuba diver on a coral reef Hybrid coral reef restoration: A cost-effective, nature-based solution to protect people and property (AD)
Hybrid coral reef restoration: A cost-effective, nature-based solution to protect people and property (AD)

Coral reef restoration can protect hundreds of millions of dollars of coastal property and business activity annually from storm-driven flooding.

It can protect thousands of people, especially children, the elderly, minorities, and those below the poverty line. Thus, coral reef restoration is a mechanism to provide environmental equity.

Audio

Thumbnail image for Eyes on Earth Episode 120 – Mapping the California Coastline showing guest Sean Vitousek on a watercraft
Thumbnail image for EoE Episode 120 – Mapping the California Coastline
Eyes on Earth Episode 120 – Mapping the California Coastline
Thumbnail image for Eyes on Earth Episode 120 – Mapping the California Coastline showing guest Sean Vitousek on a watercraft
Thumbnail image for EoE Episode 120 – Mapping the California Coastline
Eyes on Earth Episode 120 – Mapping the California Coastline

In this episode of Eyes on Earth, we begin a series on Landsat’s usefulness in coastal studies. First, we talk with Sean Vitousek, a USGS research oceanographer, about changes to beaches in California and how he is using Landsat and other data to create models that can predict how the coastline may change in the future because of sea level rise and coastal erosion.

In this episode of Eyes on Earth, we begin a series on Landsat’s usefulness in coastal studies. First, we talk with Sean Vitousek, a USGS research oceanographer, about changes to beaches in California and how he is using Landsat and other data to create models that can predict how the coastline may change in the future because of sea level rise and coastal erosion.

Webcams

View of an Arctic beach area with gentle waters.
Nuvuk video camera 2 dark image

Two video cameras are installed atop a utility pole near the northernmost point of land in the United States at Nuvuk (Point Barrow), Alaska. The cameras point northwest toward the Arctic Ocean and the boundary between the Chukchi and Beaufort Seas. Every half hour during daylight hours, the cameras collect snapshots and video for 10 minutes.

Two video cameras are installed atop a utility pole near the northernmost point of land in the United States at Nuvuk (Point Barrow), Alaska. The cameras point northwest toward the Arctic Ocean and the boundary between the Chukchi and Beaufort Seas. Every half hour during daylight hours, the cameras collect snapshots and video for 10 minutes.

View of an Arctic beach area with gentle waters.
Nuvuk video camera 1 dark image

Two video cameras are installed atop a utility pole near the northernmost point of land in the United States at Nuvuk (Point Barrow), Alaska. The cameras point northwest toward the Arctic Ocean and the boundary between the Chukchi and Beaufort Seas. Every half hour during daylight hours, the cameras collect snapshots and video for 10 minutes.

Two video cameras are installed atop a utility pole near the northernmost point of land in the United States at Nuvuk (Point Barrow), Alaska. The cameras point northwest toward the Arctic Ocean and the boundary between the Chukchi and Beaufort Seas. Every half hour during daylight hours, the cameras collect snapshots and video for 10 minutes.

View of an Arctic beach area with gentle waters.
Nuvuk video camera 2 bright image

Two video cameras are installed atop a utility pole near the northernmost point of land in the United States at Nuvuk (Point Barrow), Alaska. The cameras point northwest toward the Arctic Ocean and the boundary between the Chukchi and Beaufort Seas. Every half hour during daylight hours, the cameras collect snapshots and video for 10 minutes.

Two video cameras are installed atop a utility pole near the northernmost point of land in the United States at Nuvuk (Point Barrow), Alaska. The cameras point northwest toward the Arctic Ocean and the boundary between the Chukchi and Beaufort Seas. Every half hour during daylight hours, the cameras collect snapshots and video for 10 minutes.

View of an Arctic beach area with gentle waters.
Nuvuk video camera 2 variance image

Two video cameras are installed atop a utility pole near the northernmost point of land in the United States at Nuvuk (Point Barrow), Alaska. The cameras point northwest toward the Arctic Ocean and the boundary between the Chukchi and Beaufort Seas. Every half hour during daylight hours, the cameras collect snapshots and video for 10 minutes.

Two video cameras are installed atop a utility pole near the northernmost point of land in the United States at Nuvuk (Point Barrow), Alaska. The cameras point northwest toward the Arctic Ocean and the boundary between the Chukchi and Beaufort Seas. Every half hour during daylight hours, the cameras collect snapshots and video for 10 minutes.

View of an Arctic beach area with gentle waters.
Nuvuk video camera 1 time exposure

Two video cameras are installed atop a utility pole near the northernmost point of land in the United States at Nuvuk (Point Barrow), Alaska. The cameras point northwest toward the Arctic Ocean and the boundary between the Chukchi and Beaufort Seas. Every half hour during daylight hours, the cameras collect snapshots and video for 10 minutes.

Two video cameras are installed atop a utility pole near the northernmost point of land in the United States at Nuvuk (Point Barrow), Alaska. The cameras point northwest toward the Arctic Ocean and the boundary between the Chukchi and Beaufort Seas. Every half hour during daylight hours, the cameras collect snapshots and video for 10 minutes.

View of an Arctic beach area with gentle waters.
Nuvuk video camera 2 snapshop

Two video cameras are installed atop a utility pole near the northernmost point of land in the United States at Nuvuk (Point Barrow), Alaska. The cameras point northwest toward the Arctic Ocean and the boundary between the Chukchi and Beaufort Seas. Every half hour during daylight hours, the cameras collect snapshots and video for 10 minutes.

Two video cameras are installed atop a utility pole near the northernmost point of land in the United States at Nuvuk (Point Barrow), Alaska. The cameras point northwest toward the Arctic Ocean and the boundary between the Chukchi and Beaufort Seas. Every half hour during daylight hours, the cameras collect snapshots and video for 10 minutes.

Was this page helpful?