Maps of spatial patterns of live coral cover and change by site at Puʻukoholā Heiau National Historic Site
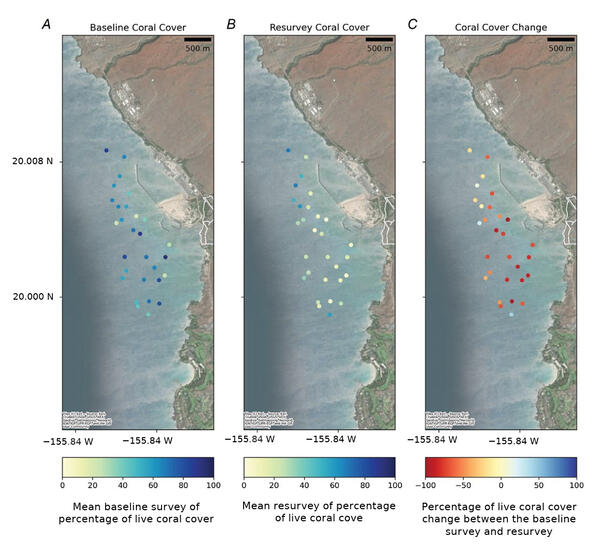
Maps of spatial patterns of live coral cover and change by site at Puʻukoholā Heiau National Historic SiteMaps of spatial patterns of live coral cover and change by site at Puʻukoholā Heiau National Historic Site. A) Mean baseline survey of percentage of live coral cover. B) Mean resurvey of percentage of live coral. C) Percent change of live coral cover between the baseline and resurvey.