
Images
Pacific Coastal and Marine Science Center images.
Filter Total Items: 1387
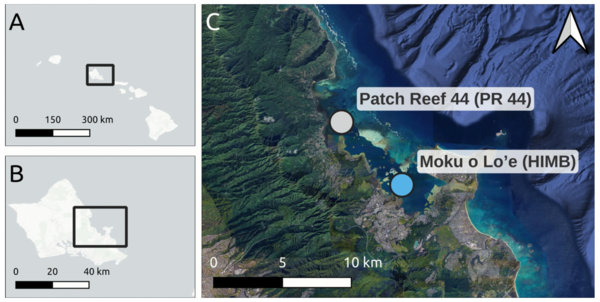
Study area - Impact of warming and suspended terrigenous sediment on the Hawaiian reef coral Montipora capitata

Photo showing personal watercraft equipped with survey equipment used during the mapping mission
Photo showing personal watercraft equipped with survey equipment used during the mapping missionPhoto showing personal watercraft equipped with survey equipment used during the mapping mission at the Elwha River mouth.
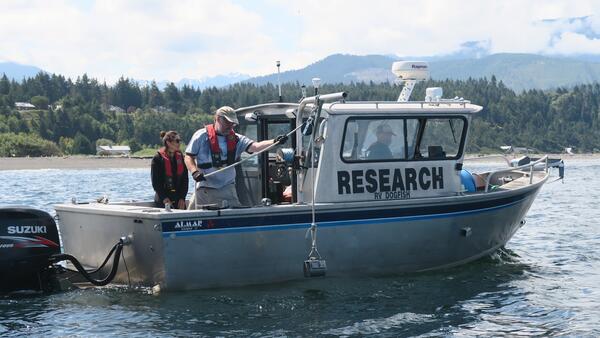
Photo showing collection of sediment samples used for grain size analysis
Photo showing collection of sediment samples used for grain size analysisPhoto showing collection of sediment samples used for grain size analysis at the Elwha River mouth.
Photo showing collection of sediment samples used for grain size analysis
Photo showing collection of sediment samples used for grain size analysisPhoto showing collection of sediment samples used for grain size analysis at the Elwha River mouth.
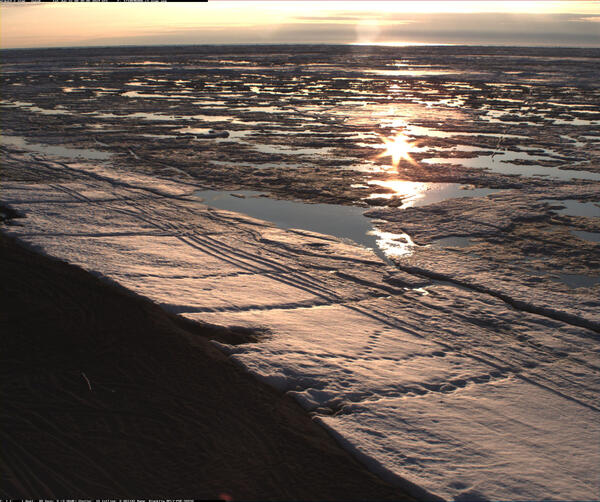
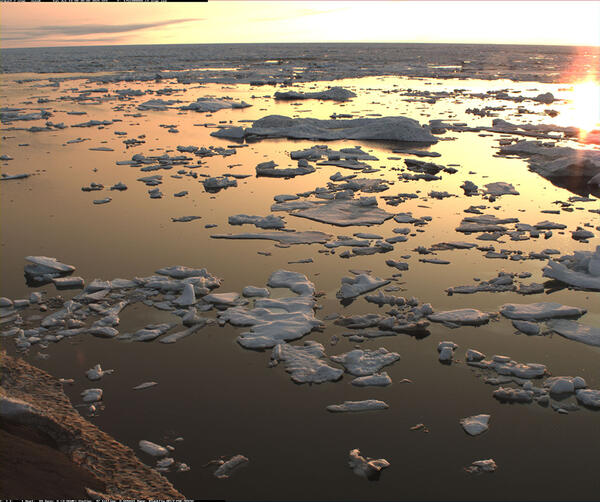
Sea ice at Nuvuk, Alaska on June 22 2024
Sea ice at Nuvuk, Alaska on June 22 2024, captured by a coastal observing video camera.
Sea ice at Nuvuk, Alaska on June 22 2024, captured by a coastal observing video camera.
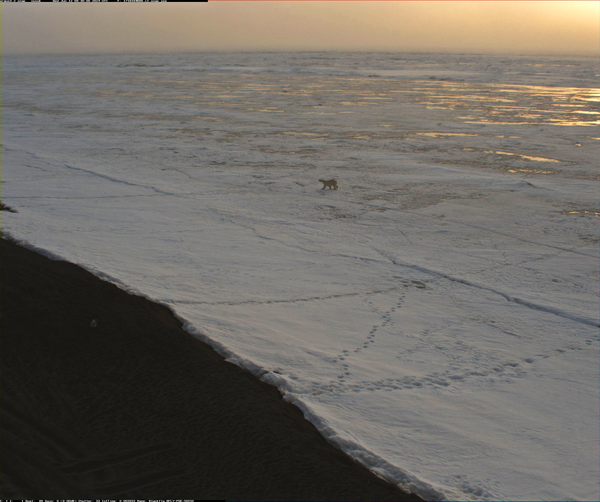
A polar bear walking on sea ice at Nuvuk, Alaska on June 12 2024
A polar bear walking on sea ice at Nuvuk, Alaska on June 12 2024A polar bear walking on sea ice at Nuvuk, Alaska on June 12 2024, captured by a coastal observing video camera.
A polar bear walking on sea ice at Nuvuk, Alaska on June 12 2024
A polar bear walking on sea ice at Nuvuk, Alaska on June 12 2024A polar bear walking on sea ice at Nuvuk, Alaska on June 12 2024, captured by a coastal observing video camera.
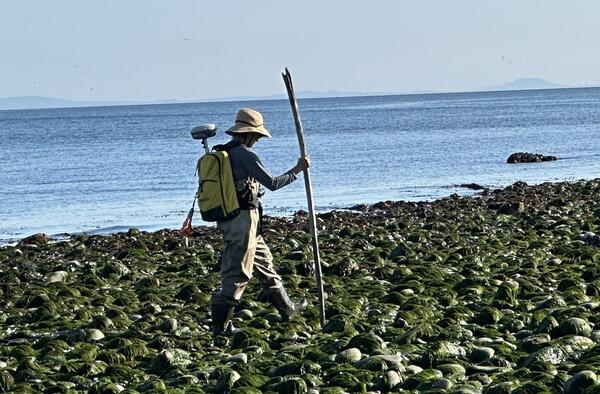
Picture of surveyor equipped with survey equipment during mapping mission
Picture of surveyor equipped with survey equipment during mapping missionPicture of surveyor equipped with survey equipment during mapping mission of the Elwha River mouth.
Picture of surveyor equipped with survey equipment during mapping mission
Picture of surveyor equipped with survey equipment during mapping missionPicture of surveyor equipped with survey equipment during mapping mission of the Elwha River mouth.
Sea ice at Nuvuk, Alaska on July 13 2025
Sea ice at Nuvuk, Alaska on July 13 2025, captured by a coastal observing video camera.
Sea ice at Nuvuk, Alaska on July 13 2025, captured by a coastal observing video camera.
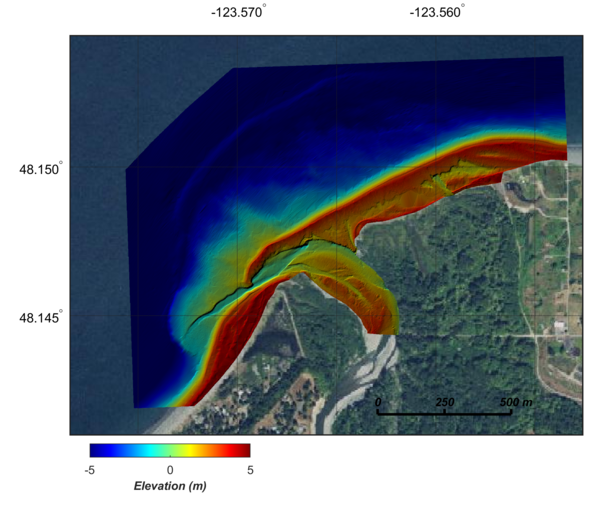
Map showing 1-m resolution digital elevation model (DEM) of Elwha River mouth
Map showing 1-m resolution digital elevation model (DEM) of Elwha River mouthMap showing 1-m resolution digital elevation model (DEM) of Elwha River mouth in Washington.
Map showing 1-m resolution digital elevation model (DEM) of Elwha River mouth
Map showing 1-m resolution digital elevation model (DEM) of Elwha River mouthMap showing 1-m resolution digital elevation model (DEM) of Elwha River mouth in Washington.
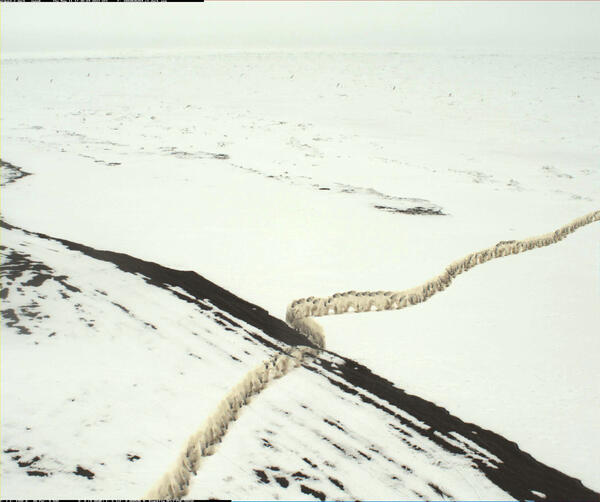
A composite of 10 minutes of 2Hz images taken by a coastal camera at Nuvuk, Alaska
A composite of 10 minutes of 2Hz images taken by a coastal camera at Nuvuk, AlaskaA composite of 10 minutes of 2Hz images taken by a coastal camera at Nuvuk, Alaska, showing a polar bear walking toward the camera.
A composite of 10 minutes of 2Hz images taken by a coastal camera at Nuvuk, Alaska
A composite of 10 minutes of 2Hz images taken by a coastal camera at Nuvuk, AlaskaA composite of 10 minutes of 2Hz images taken by a coastal camera at Nuvuk, Alaska, showing a polar bear walking toward the camera.
Scientists recovering the shadowgraph camera during the Hawaii Abyssal Nodules Expedition.jpg
Scientists recovering the shadowgraph camera during the Hawaii Abyssal Nodules Expedition.jpgScientists recovering the shadowgraph camera during the Hawaii Abyssal Nodules Expedition. Learn more about the expedition here.
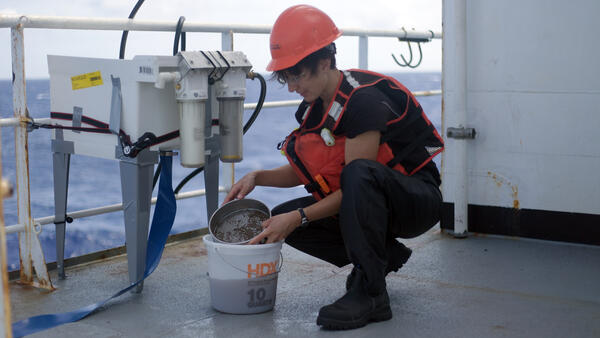
Scientist sifting through deep-sea mud for infauna during the Hawaii Abyssal Nodules Expedition.jpg
Scientist sifting through deep-sea mud for infauna during the Hawaii Abyssal Nodules Expedition.jpgScientist sifting through deep-sea mud for infauna during the Hawaii Abyssal Nodules Expedition. Learn more about the expedition here.
Scientists with a box core sample during the Hawaii Abyssal Nodules Expedition.jpg
Scientists with a box core sample during the Hawaii Abyssal Nodules Expedition.jpgScientists with a box core sample during the Hawaii Abyssal Nodules Expedition. Learn more about the expedition here.
Scientists with a box core sample during the Hawaii Abyssal Nodules Expedition.jpg
Scientists with a box core sample during the Hawaii Abyssal Nodules Expedition.jpgScientists with a box core sample during the Hawaii Abyssal Nodules Expedition. Learn more about the expedition here.
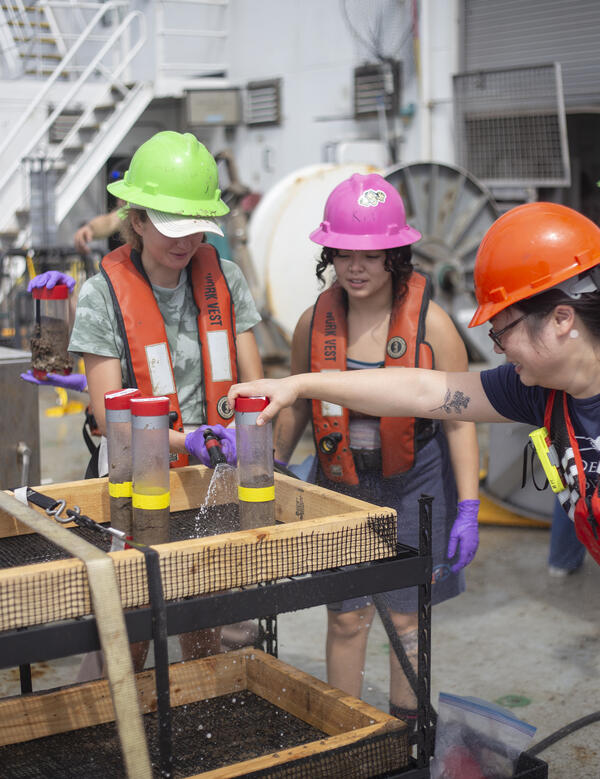
Scientists preparing push core samples during the Hawaii Abyssal Nodules Expedition.jpg
Scientists preparing push core samples during the Hawaii Abyssal Nodules Expedition.jpgScientists preparing push core samples during the Hawaii Abyssal Nodules Expedition. Learn more about the expedition here.
Scientists preparing push core samples during the Hawaii Abyssal Nodules Expedition.jpg
Scientists preparing push core samples during the Hawaii Abyssal Nodules Expedition.jpgScientists preparing push core samples during the Hawaii Abyssal Nodules Expedition. Learn more about the expedition here.
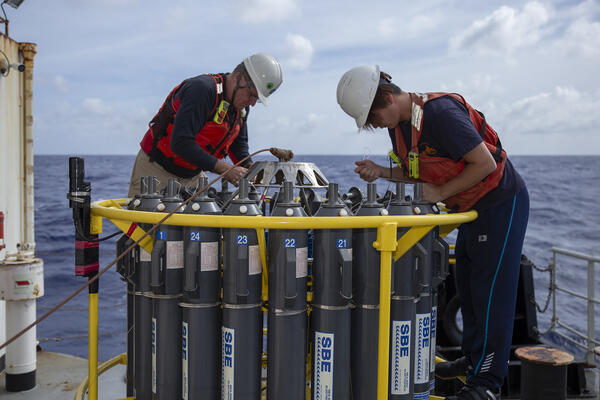
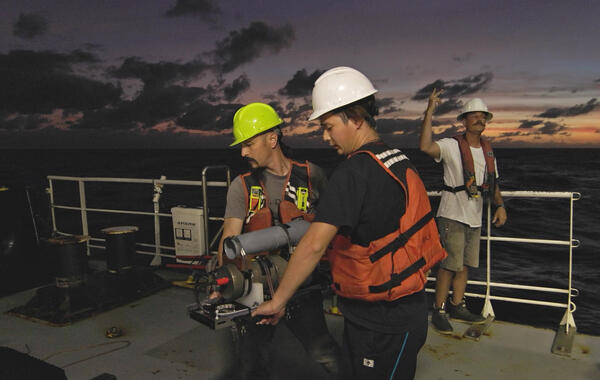
Preparing the CTD rosette during the Hawaii Abyssal Nodules Expedition.jpg
Preparing the CTD rosette during the Hawaii Abyssal Nodules Expedition.jpgPreparing the CTD rosette during the Hawaii Abyssal Nodules Expedition. Learn more about the expedition here.
Preparing the CTD rosette during the Hawaii Abyssal Nodules Expedition.jpg
Preparing the CTD rosette during the Hawaii Abyssal Nodules Expedition.jpgPreparing the CTD rosette during the Hawaii Abyssal Nodules Expedition. Learn more about the expedition here.

Scientists removing top water from a box core sample during the Hawaii Abyssal Nodules Expedition.jpg
Scientists removing top water from a box core sample during the Hawaii Abyssal Nodules Expedition.jpgScientists removing top water from a box core sample during the Hawaii Abyssal Nodules Expedition. Learn more about the expedition here.
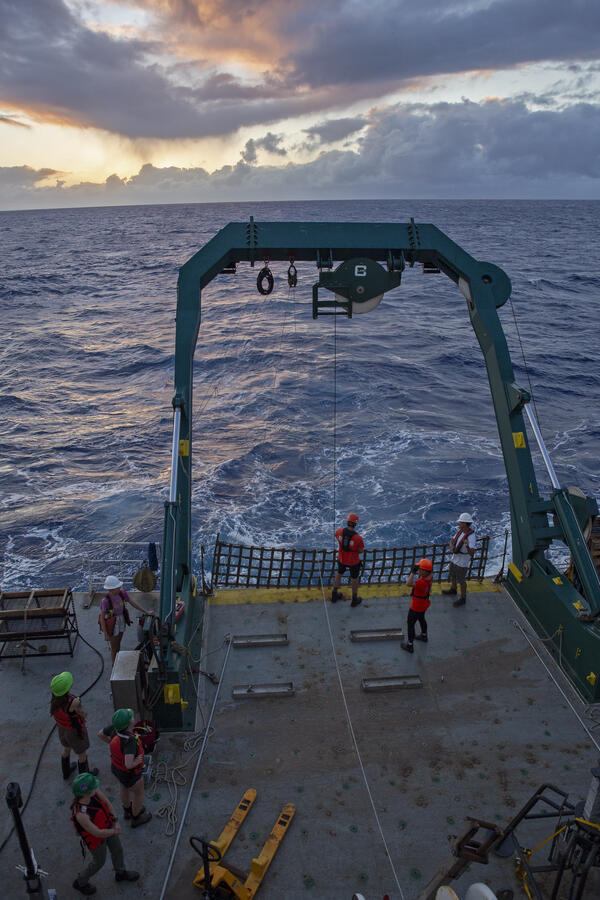
Back deck of the Kilo Moana during the Hawaii Abyssal Nodules Expedition.jpg
Back deck of the Kilo Moana during the Hawaii Abyssal Nodules Expedition.jpgBack deck of the Kilo Moana during the Hawaii Abyssal Nodules Expedition. Learn more about the expedition here.
Back deck of the Kilo Moana during the Hawaii Abyssal Nodules Expedition.jpg
Back deck of the Kilo Moana during the Hawaii Abyssal Nodules Expedition.jpgBack deck of the Kilo Moana during the Hawaii Abyssal Nodules Expedition. Learn more about the expedition here.

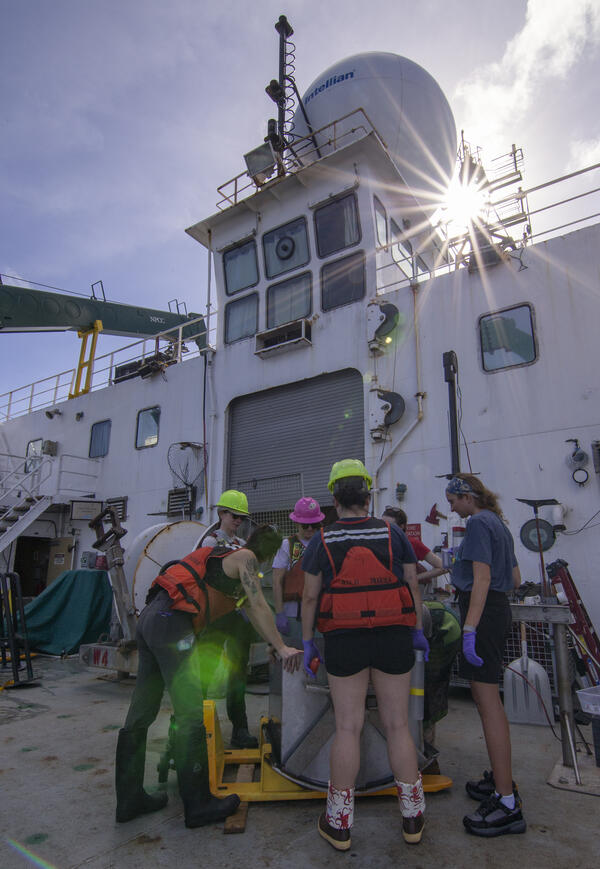
Scientists preparing to process a box core sample during the Hawaii Abyssal Nodules Expedition.jpg
Scientists preparing to process a box core sample during the Hawaii Abyssal Nodules Expedition.jpgScientists preparing to process a box core sample during the Hawaii Abyssal Nodules Expedition. Learn more about the expedition here.
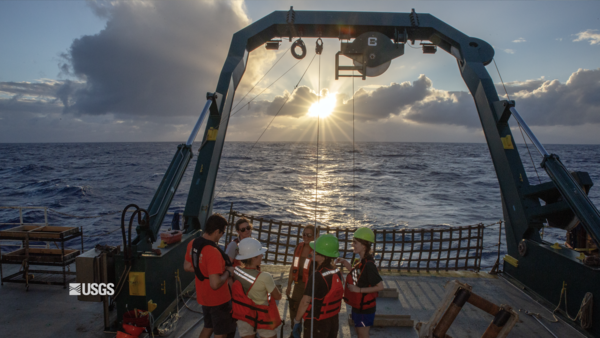
Cover image for Hawai'i Abyssal Nodules Expedition video
Cover image for Hawai'i Abyssal Nodules Expedition videoIn Fall 2025 the Hawaiʻi Abyssal Nodules and Associated Ecosystems Expedition, led by USGS scientists, will investigate the geology, minerals, and environmental setting of the deep seabed offshore Moku o Keawe (Hawaiʻi Island) in the U.S. Exclusive Economic Zone. This work is part of ongoing collaborative efforts with BOEM and NOAA.
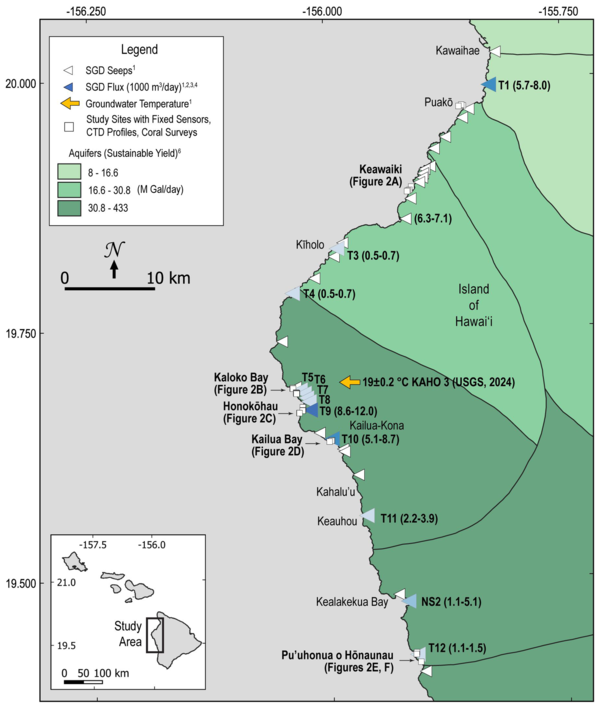
Map showing locations of mapped groundwater seeps in western Big Island, Hawaii
Map showing locations of mapped groundwater seeps in western Big Island, HawaiiMap showing locations of mapped groundwater seeps (white triangles), estimated fluxes of submarine groundwater discharge (blue triangles), groundwater temperature (orange arrow), and study sites (white squares) from the study Submarine groundwater discharge creates
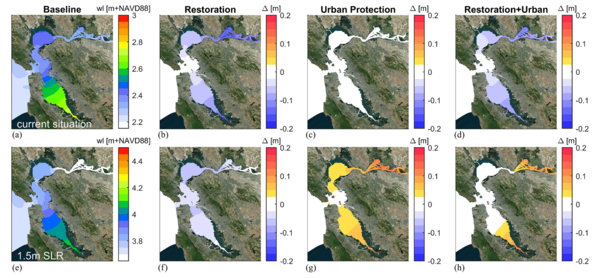
Extreme 2-year water levels in SF Bay under baseline; restoration; urban; and combined scenarios at current versus 1.5 m SLR
Extreme 2-year water levels in SF Bay under baseline; restoration; urban; and combined scenarios at current versus 1.5 m SLRExtreme 2-year water levels in SF Bay under baseline; restoration; urban; and combined scenarios at current versus 1.5 m SLR. From the study Mitigating Flood Risks in Urban Estuaries: Tidal Dynamics, Shoreline Hardening, Nature-Based Solutions, and Floodgates in San Francisco Bay.
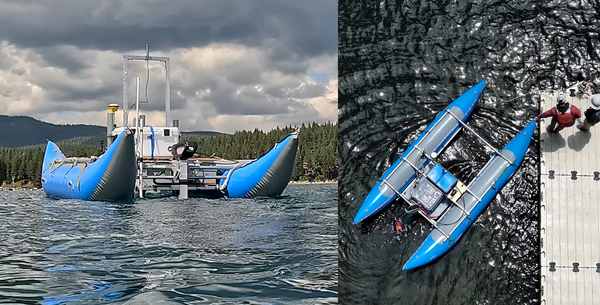
Photos of the autonomous MAPCAT cataraft being tested
Photos of the autonomous MAPCAT cataraft being testedThe Autonomous MAPping CATaraft, or “Autonomous MAPCAT”, is a remotely controlled, 14 foot long by 7 foot wide boat, built from an inflatable pontoon, aluminum frame, whitewater cataraft.
Photos of the autonomous MAPCAT cataraft being tested
Photos of the autonomous MAPCAT cataraft being testedThe Autonomous MAPping CATaraft, or “Autonomous MAPCAT”, is a remotely controlled, 14 foot long by 7 foot wide boat, built from an inflatable pontoon, aluminum frame, whitewater cataraft.