Mud Creek Topo Change June 13-October 12 2017 View 2
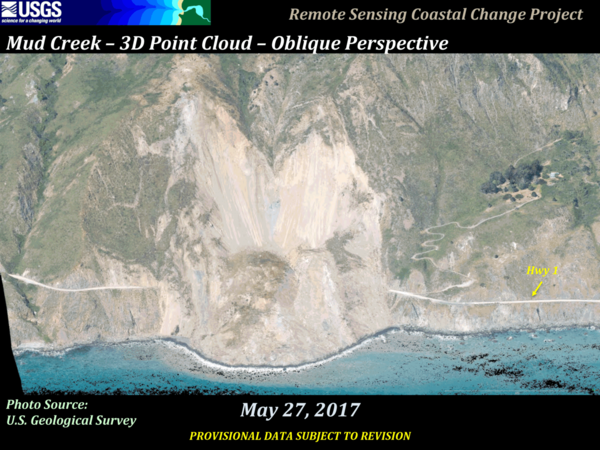
Mud Creek Topo Change June 13-October 12 2017 View 2In 2017, the massive Mud Creek landslide buried a quarter-mile of the famous coastal route, California’s Highway 1, with rocks and dirt more than 65 feet deep. USGS monitors erosion along the landslide-prone cliffs of Big Sur, collecting aerial photos frequently throughout the year.