
The Native communities’ in-ground food storage facilities are being lost as a result of eroding bluffs and thawing permafrost.
Images
Pacific Coastal and Marine Science Center images.
Filter Total Items: 1387

Native community in-ground food storage
The Native communities’ in-ground food storage facilities are being lost as a result of eroding bluffs and thawing permafrost.

Night Recovery of the Multichannel Seismic System
Looking astern, the airgun sled is in its cradle in the center of the photo. The crew are manually recovering the multichannel streamer and beginning the large figure-8 shape of coiling it on deck. Work at sea occurs 24 hours a day. In late September, there is ~12 hours of night, resulting in gear recovery at night.
Looking astern, the airgun sled is in its cradle in the center of the photo. The crew are manually recovering the multichannel streamer and beginning the large figure-8 shape of coiling it on deck. Work at sea occurs 24 hours a day. In late September, there is ~12 hours of night, resulting in gear recovery at night.

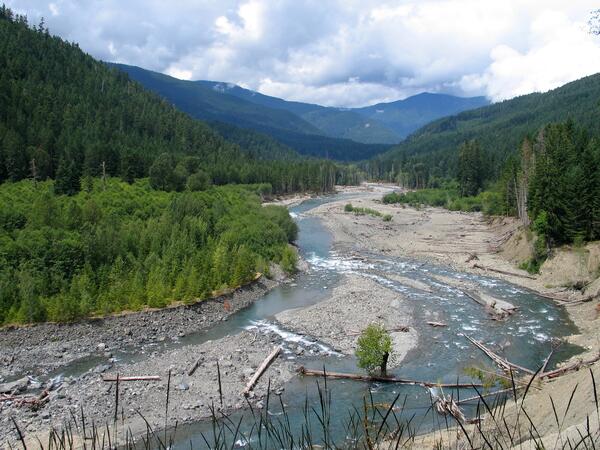
USGS divers in the Elwha River
USGS divers Steve Rubin and Reg Reisenbichler laying out a survey transect in the Elwha River in northern Washington.
USGS divers Steve Rubin and Reg Reisenbichler laying out a survey transect in the Elwha River in northern Washington.

Birds Take Flight on Alaska's Coast
This photograph shows birds taking flight near Icy Cape on the Chukchi Sea coast of Alaska, an area that provides habitat for a variety of avian species.
This photograph shows birds taking flight near Icy Cape on the Chukchi Sea coast of Alaska, an area that provides habitat for a variety of avian species.

PCMSC research vessel Parke Snavely on Nisqually Reach
PCMSC research vessel Parke Snavely on Nisqually ReachUSGS Pacific Coastal and Marine Science Center’s research vessel R/V Parke Snavely motors on the Nisqually Reach of Puget Sound.
PCMSC research vessel Parke Snavely on Nisqually Reach
PCMSC research vessel Parke Snavely on Nisqually ReachUSGS Pacific Coastal and Marine Science Center’s research vessel R/V Parke Snavely motors on the Nisqually Reach of Puget Sound.

Kelp Greenling in Half Moon Bay
Kelp greenling fish, about 8 inches long, swims above a seafloor of mixed gravel, cobble, and rock near Half Moon Bay, California.
Kelp greenling fish, about 8 inches long, swims above a seafloor of mixed gravel, cobble, and rock near Half Moon Bay, California.

Collecting bathymetry on R/V Parke Snavely
Eric Grossman and Rob Wyland reviewing bathymetry data as it's being collected, on R/V Parke Snavely.
Eric Grossman and Rob Wyland reviewing bathymetry data as it's being collected, on R/V Parke Snavely.
Installing oceanographic monitoring instrumentation on the seafloor
Installing oceanographic monitoring instrumentation on the seafloorUSGS research geologist Curt Storlazzi installs an instrument package on the seafloor of Maunalua Bay, Oʻahu. The platform, called a MiniPROBE, hosts six upward-looking acoustic Doppler current profilers (ADCP), seven conductivity and temperature (CT) sensors, and eight self-logging optical backscatter sensors (SLOBS).

Grand Canyon sand
Grand Canyon sand was photographed with a hand-held point-and-shoot camera in a waterproof housing.
Grand Canyon sand was photographed with a hand-held point-and-shoot camera in a waterproof housing.

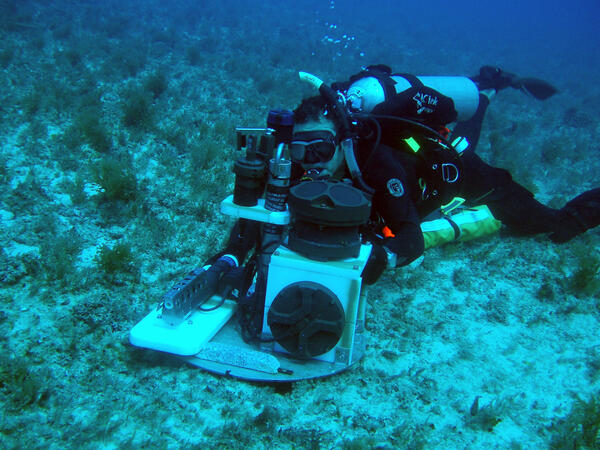
Deploying the poking eyeball
USGS scientists from the Pacific Coastal and Marine Science Center (PCMSC) in Santa Cruz, California deploy an instrument called the poking eyeball. The system, developed by PCMSC, was designed to take repetitive microscopic images of the seabed from a tripod on the seafloor.
USGS scientists from the Pacific Coastal and Marine Science Center (PCMSC) in Santa Cruz, California deploy an instrument called the poking eyeball. The system, developed by PCMSC, was designed to take repetitive microscopic images of the seabed from a tripod on the seafloor.

Arctic Ocean Extended Continental Shelf Surveys 2008-2011
Arctic Ocean Extended Continental Shelf Surveys 2008-2011Helicopter on the deck of a Canadian coast guard ice breaker ship in the Arctic Ocean.
Arctic Ocean Extended Continental Shelf Surveys 2008-2011
Arctic Ocean Extended Continental Shelf Surveys 2008-2011Helicopter on the deck of a Canadian coast guard ice breaker ship in the Arctic Ocean.
Elwha River - Humes Ranch Area
Photo of Elwha River near the Humes Ranch Area in September 2008, showing large woody debris along channel.
Photo of Elwha River near the Humes Ranch Area in September 2008, showing large woody debris along channel.

U.S. and Canadian Ships in Arctic Ocean
Helicopter view of Canadian Coast Guard Ship Louis S. St. Laurent (top) and U.S. Coast Guard Cutter Healy (bottom) on the Arctic Ocean. This was during a scientific expedition to map the extended continental shelf in the Arctic Ocean.
Helicopter view of Canadian Coast Guard Ship Louis S. St. Laurent (top) and U.S. Coast Guard Cutter Healy (bottom) on the Arctic Ocean. This was during a scientific expedition to map the extended continental shelf in the Arctic Ocean.

U.S. and Canadian Coast Guard Ships in Arctic Ocean
U.S. and Canadian Coast Guard Ships in Arctic OceanHelicopter view of Canadian Coast Guard Ship Louis S. St. Laurent (top) and U.S. Coast Guard Cutter Healy (bottom) on the Arctic Ocean. This was during a scientific expedition to map the extended continental shelf in the Arctic Ocean.

Permafrost Erosion Measurement
USGS researcher Benjamin Jones examines a collapsed block of ice-rich permafrost on Barter Island along Alaska's Arctic coast.
USGS researcher Benjamin Jones examines a collapsed block of ice-rich permafrost on Barter Island along Alaska's Arctic coast.

Sunflower sea star on the seafloor
Photograph of the seafloor off the California coast showing coarse sand, shells, and a sunflower sea star. It was taken during a "ground-truthing" survey off of Salt Point, California, in support of the California Seafloor Mapping Program.
Photograph of the seafloor off the California coast showing coarse sand, shells, and a sunflower sea star. It was taken during a "ground-truthing" survey off of Salt Point, California, in support of the California Seafloor Mapping Program.

Edmonds, WA train tracks
Train tracks and overwater structures along Browns Bay in Edmonds, Washington often occur on developed shorelines of Puget Sound. The built environment can interrupt the flow of sediment from back-beach bluffs to the intertidal zone, attenuate and redirect alongshore currents, and reduce upper beach habitat.
Train tracks and overwater structures along Browns Bay in Edmonds, Washington often occur on developed shorelines of Puget Sound. The built environment can interrupt the flow of sediment from back-beach bluffs to the intertidal zone, attenuate and redirect alongshore currents, and reduce upper beach habitat.

Fish and coral in Tumon Bay Marine Reserve, Guam
Underwater photograph of Tumon Bay Marine Reserve, Guam, showing some of the amazing biologic diversity of coral reefs.
Underwater photograph of Tumon Bay Marine Reserve, Guam, showing some of the amazing biologic diversity of coral reefs.

Bleached coral in Tumon
Underwater photo of a stressed coral mound in Tumon Bay Marine Preserve in Guam.
Underwater photo of a stressed coral mound in Tumon Bay Marine Preserve in Guam.

Natural Bridges State Beach, Santa Cruz, California
Natural Bridges State Beach, Santa Cruz, CaliforniaPhotograph of the coastal region of Natural Bridges State Beach in Santa Cruz, California
Natural Bridges State Beach, Santa Cruz, California
Natural Bridges State Beach, Santa Cruz, CaliforniaPhotograph of the coastal region of Natural Bridges State Beach in Santa Cruz, California

Does Pleasure Point Need a Seawall?
The USGS, in cooperation with Santa Cruz County and the California Department of Boating and Waterways, studied the seacliffs, ocean floor, and waves of Pleasure Point, California. We created detailed maps of the seacliffs and ocean floor using LIDAR laser scanners and sonar.
The USGS, in cooperation with Santa Cruz County and the California Department of Boating and Waterways, studied the seacliffs, ocean floor, and waves of Pleasure Point, California. We created detailed maps of the seacliffs and ocean floor using LIDAR laser scanners and sonar.