Orbicella annularis bleaching during 2026 marine heatwave in the Florida Keys
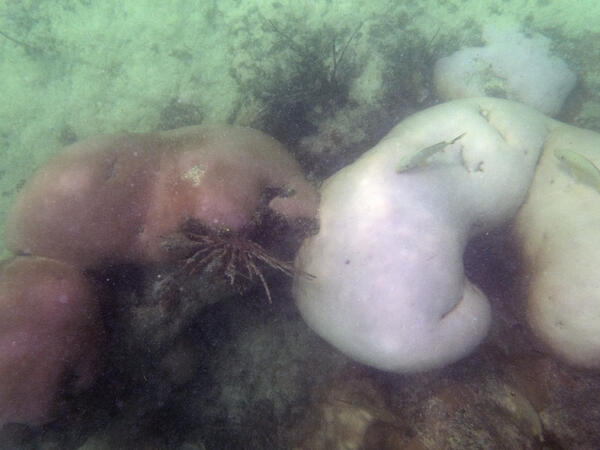
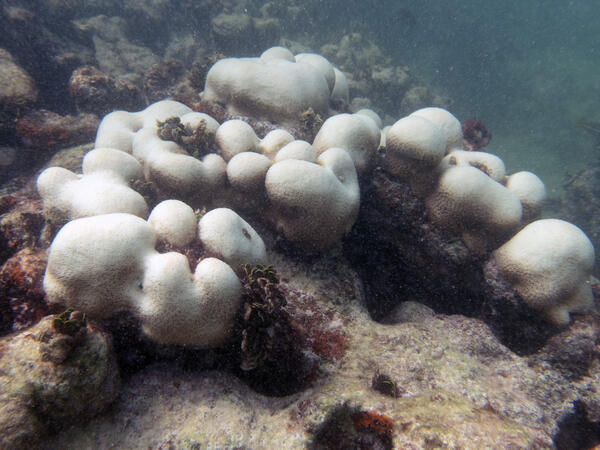
Orbicella annularis bleaching during 2026 marine heatwave in the Florida KeysLobed star coral (Orbicella annularis) bleaching during the 2026 marine heatwave in the Florida Keys. Taken on July 12, 2026 at Newfound Harbor, an inshore patch reef in the Lower Florida Keys.