Two shards of Native American pottery found at shell midden site that is located on an actively eroding shoreline of Apalachicola Bay. The shards show distinctive markings created by paleo Indians thousands of years ago.
Images
St. Petersburg Coastal and Marine Science Center images.
Two shards of Native American pottery found at shell midden site that is located on an actively eroding shoreline of Apalachicola Bay. The shards show distinctive markings created by paleo Indians thousands of years ago.
Rock breakwaters are used to protect marsh shoreline from erosion
Rock breakwaters are used to protect marsh shoreline from erosionThe estuarine shoreline of barrier islands along the Gulf of America are vulnerable to shoreline erosion. Structures, such as this rock breakwater, can be used to protect the shoreline from erosional waves.
Rock breakwaters are used to protect marsh shoreline from erosion
Rock breakwaters are used to protect marsh shoreline from erosionThe estuarine shoreline of barrier islands along the Gulf of America are vulnerable to shoreline erosion. Structures, such as this rock breakwater, can be used to protect the shoreline from erosional waves.
The estuarine (backbarrier) shoreline of barrier islands in Gulf of America are complex, ecologically diverse habitats that are under threat due to human development, sea level rise, and storms.
Native American shell midden is exposed to erosion from sea level rise and storms
Native American shell midden is exposed to erosion from sea level rise and stormsFlorida archaeologist, Nicole Grinnan, talks about the vulnerability of Native American shell middens to coastal erosion from sea level rise and storms along the Apalachicola Bay.
Native American shell midden is exposed to erosion from sea level rise and storms
Native American shell midden is exposed to erosion from sea level rise and stormsFlorida archaeologist, Nicole Grinnan, talks about the vulnerability of Native American shell middens to coastal erosion from sea level rise and storms along the Apalachicola Bay.
USGS Coastal Change Hazards Portal shows Hurricane Beryl's expected impacts
USGS Coastal Change Hazards Portal shows Hurricane Beryl's expected impactsPotential coastal change impacts are predicted during a direct landfall of Hurricane Beryl on the Texas coast at 4:00 am, Sunday, July 7, 2024.
USGS Coastal Change Hazards Portal shows Hurricane Beryl's expected impacts
USGS Coastal Change Hazards Portal shows Hurricane Beryl's expected impactsPotential coastal change impacts are predicted during a direct landfall of Hurricane Beryl on the Texas coast at 4:00 am, Sunday, July 7, 2024.
U.S. Geological Survey projects Beryl’s potential impact when it strikes Texas’ coast
U.S. Geological Survey projects Beryl’s potential impact when it strikes Texas’ coastA screenshot of the U.S. Geological Survey's costal change hazards portal, indicates the forecast of Tropical Storm Beryl's impact on the coast of Texas. The three red lines indicate the collision, wave and water sand dune overwash, and dune inundation.
U.S. Geological Survey projects Beryl’s potential impact when it strikes Texas’ coast
U.S. Geological Survey projects Beryl’s potential impact when it strikes Texas’ coastA screenshot of the U.S. Geological Survey's costal change hazards portal, indicates the forecast of Tropical Storm Beryl's impact on the coast of Texas. The three red lines indicate the collision, wave and water sand dune overwash, and dune inundation.
In transit to survey the shallows of Wallops Island, Virginia
In transit to survey the shallows of Wallops Island, VirginiaSabrina Levinson, a USGS intern on the Coastal Sediment Availability and Flux Project (St. Petersburg Coastal and Marine Science Center), pilots a survey waverunner to the shallows of Wallops Island, Virginia.
In transit to survey the shallows of Wallops Island, Virginia
In transit to survey the shallows of Wallops Island, VirginiaSabrina Levinson, a USGS intern on the Coastal Sediment Availability and Flux Project (St. Petersburg Coastal and Marine Science Center), pilots a survey waverunner to the shallows of Wallops Island, Virginia.
Coastal Coupling Community of Practice Executive Committee and other subject matter experts (partial group) in front of a National Oceanic and Atmospheric Administration building and “The Hand.” From left to right: Rebecca Atkins, John Warner, Cristina Urizar, Tracy Fanara, Courtney Barry, Trey Flowers, Saeed Moghimi, David Welch, Lucila Houttuijn Bloemendaal, Chris
Animation of a computed tomography scan of a coral core
Animation of a computed tomography scan of a coral coreAnimation of a computed tomography scan of a coral core.
Animation of a computed tomography scan of a coral core
Animation of a computed tomography scan of a coral coreAnimation of a computed tomography scan of a coral core.
The newly developed USGS Coral Core Archive, housed at the Santa Cruz and St. Petersburg Coastal and Marine Science Centers, contains approximately 500 coral reef cores from U.S. jurisdictions worldwide.
Photo of coral carbonate standards, arranged from high to low density. To convert CT values to real-world densities and quantify the uncertainty in reconstructed density as a result of offsets, a set of carbonate standards are included in every CT scan that represent a range of coral species with different densities.
Coral sample in aluminum tube being prepared for scanning. The use of a secondary aluminum filter reduces beam hardening artifacts (rings) while also avoiding attenuating the x-ray beam.
Another animation of a computed tomography scan of a coral core
Another animation of a computed tomography scan of a coral coreAnimation of a computed tomography scan of a coral core.
Another animation of a computed tomography scan of a coral core
Another animation of a computed tomography scan of a coral coreAnimation of a computed tomography scan of a coral core.
Graph showing relationship between CT intensities and measured density of the coral standards used to calibrate data
Graph showing relationship between CT intensities and measured density of the coral standards used to calibrate dataExample of the relationship between CT intensities and measured density of the coral standards used to calibrate data. The measured density of the coral standards are compared to the mean intensities of each standard. Linear regressions calculated from the standard values are then used to calibrate data.
Graph showing relationship between CT intensities and measured density of the coral standards used to calibrate data
Graph showing relationship between CT intensities and measured density of the coral standards used to calibrate dataExample of the relationship between CT intensities and measured density of the coral standards used to calibrate data. The measured density of the coral standards are compared to the mean intensities of each standard. Linear regressions calculated from the standard values are then used to calibrate data.
CT scan of Orbicella coral sample with no packing material
CT scan of Orbicella coral sample with no packing materialOrbicella spp. coral sample with no packing material. Center of image is darker than edges. Transect across image shows intensity values lower in the center creating a cupping effect.
CT scan of Orbicella coral sample with no packing material
CT scan of Orbicella coral sample with no packing materialOrbicella spp. coral sample with no packing material. Center of image is darker than edges. Transect across image shows intensity values lower in the center creating a cupping effect.
DSAS generates transects that are cast perpendicular to the reference baseline to intersect shorelines at a user-specified spacing alongshore. Please note that the figure above illustrates the placement of both onshore and offshore baselines as examples. In DSAS v6.0 all baselines in a file must be placed either offshore or onshore, not combined.
The Digital Shoreline Analysis System (DSAS) version 6 is a standalone application that calculates shoreline or boundary change over time. The GIS of a user’s choice is used to prepare the data for DSAS. Like previous versions, DSAS v.6 enables a user to calculate rate-of-change statistics from multiple historical shoreline positions.
Donya Frank-Gilchrist (SPCMSC) manages the USGS booth at the 2024 SCDRP annual meeting
Donya Frank-Gilchrist (SPCMSC) manages the USGS booth at the 2024 SCDRP annual meetingDonya Frank-Gilchrist (SPCMSC) manages the USGS booth at the recent SCDRP annual meeting to share USGS data and tools with community resilience partners and stakeholders.
Donya Frank-Gilchrist (SPCMSC) manages the USGS booth at the 2024 SCDRP annual meeting
Donya Frank-Gilchrist (SPCMSC) manages the USGS booth at the 2024 SCDRP annual meetingDonya Frank-Gilchrist (SPCMSC) manages the USGS booth at the recent SCDRP annual meeting to share USGS data and tools with community resilience partners and stakeholders.
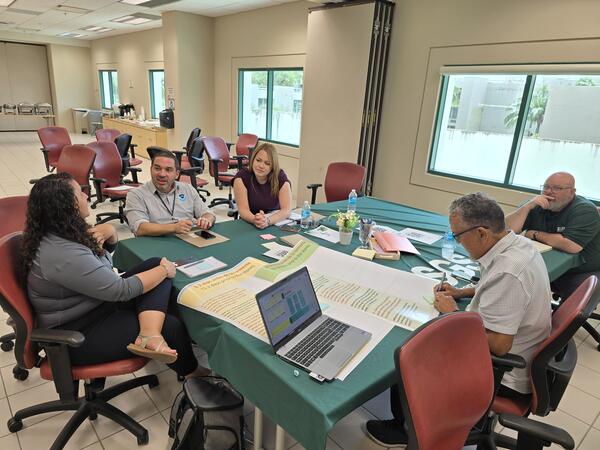
On January 17-18, 2024, John Warner provided a two-day training for the COAWST (Coupled Ocean-Atmosphere-Waves-Sediment Transport) modeling system.
USGS Scientists preparing Sediment Traps for deployment
USGS Scientists preparing Sediment Traps for deploymentUSGS Scientists Caitlin Reynolds and Rosalie Cruikshank are aboard the R/V Pelican in the northern Gulf of America. They are preparing two sediment traps for deployment. Sediments are caught in the large area at the top of the funnels, then collected in a bottle at the bottom.
USGS Scientists preparing Sediment Traps for deployment
USGS Scientists preparing Sediment Traps for deploymentUSGS Scientists Caitlin Reynolds and Rosalie Cruikshank are aboard the R/V Pelican in the northern Gulf of America. They are preparing two sediment traps for deployment. Sediments are caught in the large area at the top of the funnels, then collected in a bottle at the bottom.
Bleaching Elkhorn coral in Buck Island Reef National Monument
Bleaching Elkhorn coral in Buck Island Reef National MonumentShown here is a photograph taken on October 20, 2023, of a wild Elkhorn coral colony in Buck Island Reef National Monument, St. Croix, VI, showing the effects of heat stress caused by elevated ocean temperatures. The heat stress causes “coral bleaching,” or the loss of nutrient-giving microscopic algae that normally live within corals.
Bleaching Elkhorn coral in Buck Island Reef National Monument
Bleaching Elkhorn coral in Buck Island Reef National MonumentShown here is a photograph taken on October 20, 2023, of a wild Elkhorn coral colony in Buck Island Reef National Monument, St. Croix, VI, showing the effects of heat stress caused by elevated ocean temperatures. The heat stress causes “coral bleaching,” or the loss of nutrient-giving microscopic algae that normally live within corals.