
Dr. Christopher G. Smith pumps water from a submarine groundwater well on the seafloor through tubing to the R/V Halimeda and uses an instrument called a YSI to measure salinity and ensure the wells are working properly and producing groundwater.
Images
St. Petersburg Coastal and Marine Science Center images.
Filter Total Items: 745

Examining Water From a Submarine Groundwater Well
Dr. Christopher G. Smith pumps water from a submarine groundwater well on the seafloor through tubing to the R/V Halimeda and uses an instrument called a YSI to measure salinity and ensure the wells are working properly and producing groundwater.

Examining Water From a Submarine Groundwater Well
Dr. Christopher G. Smith pumps water from a submarine groundwater well on the seafloor through tubing to the R/V Halimeda and uses an instrument called a YSI to measure salinity and ensure the wells are working properly and producing groundwater.
Dr. Christopher G. Smith pumps water from a submarine groundwater well on the seafloor through tubing to the R/V Halimeda and uses an instrument called a YSI to measure salinity and ensure the wells are working properly and producing groundwater.

Restored staghorn coral (Acropora cervicornis) at Looe Key reef
Restored staghorn coral (Acropora cervicornis) at Looe Key reefRestored staghorn coral (Acropora cervicornis) at Looe Key reef in the lower Florida Keys outplanted by Mote Marine Laboratory's coral restoration program.
Restored staghorn coral (Acropora cervicornis) at Looe Key reef
Restored staghorn coral (Acropora cervicornis) at Looe Key reefRestored staghorn coral (Acropora cervicornis) at Looe Key reef in the lower Florida Keys outplanted by Mote Marine Laboratory's coral restoration program.

USGS Ocean Research
Our coasts, the most familiar part of the ocean are the gateway to the larger deeper ocean world. USGS studies processes and hazards in the coastal zone and how they affect people, wildlife, and ecosystems.
Our coasts, the most familiar part of the ocean are the gateway to the larger deeper ocean world. USGS studies processes and hazards in the coastal zone and how they affect people, wildlife, and ecosystems.

SPCMSC Core Archive
Photograph of the SPCMSC Core Laboratory’s storage stacks. The SPCMSC Core Laboratory is an archive that houses a collection of nearly 3,000 cores collected by the center and Federal, State, and university partners. These cores have been sampled from diverse study areas including coral reefs, wetlands, beaches, and marine environments from around the world.
Photograph of the SPCMSC Core Laboratory’s storage stacks. The SPCMSC Core Laboratory is an archive that houses a collection of nearly 3,000 cores collected by the center and Federal, State, and university partners. These cores have been sampled from diverse study areas including coral reefs, wetlands, beaches, and marine environments from around the world.

Successful experimental elkhorn coral colony in Dry Tortugas National Park
Successful experimental elkhorn coral colony in Dry Tortugas National ParkThe U.S.

Successful experimental elkhorn coral colony in Dry Tortugas National Park
Successful experimental elkhorn coral colony in Dry Tortugas National ParkThe U.S. Geological Survey is conducting research to guide the restoration and recovery of threatened corals in Dry Tortugas National Park and throughout the western Atlantic. Shown here is a colony of the threatened elkhorn coral, Acropora palmata, that has grown over the sides of a cinderblock experimental platform.

Three successful experimental coral colonies in Dry Tortugas National Park
Three successful experimental coral colonies in Dry Tortugas National ParkThe U.S. Geological Survey is conducting research to guide the restoration and recovery of threatened corals in Dry Tortugas National Park and throughout the western Atlantic. Shown here are two colonies of the threatened elkhorn coral, Acropora palmata, with a colony of staghorn coral, Acropora cervicornis, in the center.

Vibracore in shallow water
A vibracore being deployed by USGS staff from the FSU R/V Apalachee for the Naval Research Laboratory (NRL). The objective of this field effort was to establish a baseline environmental characterization for a test bed to predict mobility and burial of unexploded ordnance (UXO) in response to waves and currents.
A vibracore being deployed by USGS staff from the FSU R/V Apalachee for the Naval Research Laboratory (NRL). The objective of this field effort was to establish a baseline environmental characterization for a test bed to predict mobility and burial of unexploded ordnance (UXO) in response to waves and currents.
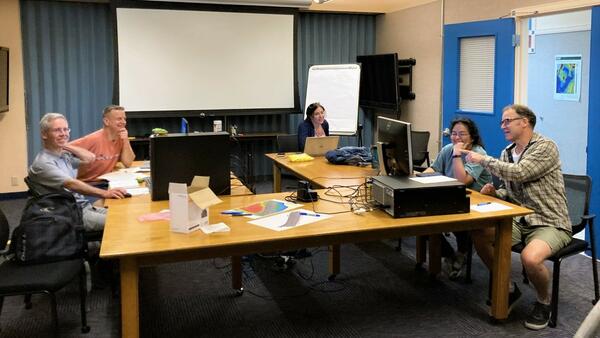
Seafloor Structure-from-Motion (SfM) ad-hoc workshop in St. Petersburg, Florida
Seafloor Structure-from-Motion (SfM) ad-hoc workshop in St. Petersburg, FloridaThe USGS Processes Impacting Seafloor Change and Ecosystem Services (PISCES) project team meeting at the St. Petersburg Coastal and Marine Science Center in May 2022 to coordinate Structure-from-motion (SfM) Quantitative Underwater Imaging Device with 5 cameras (SQUID-5) and diver-based SfM data acquisition and processing for field work.

Retrieving a sediment trap on the R/V Weatherbird II
Retrieving a sediment trap on the R/V Weatherbird IICaitlin Reynolds retrieving one of the sediment traps used by USGS to study sediment flux in the Gulf of America on board the Research Vessel (R/V) Weatherbird II (Florida Institute of Oceanography).

Taking water samples from a CTD-rosette
Eckerd College students taking water samples from a CTD-rosette on board the R/V Weatherbird
Eckerd College students taking water samples from a CTD-rosette on board the R/V Weatherbird

USGS Ocean Research
Our coasts, the most familiar part of the ocean are the gateway to the larger deeper ocean world. USGS studies processes and hazards in the coastal zone and how they affect people, wildlife, and ecosystems.
Our coasts, the most familiar part of the ocean are the gateway to the larger deeper ocean world. USGS studies processes and hazards in the coastal zone and how they affect people, wildlife, and ecosystems.

Coastal erosion model outreach activity
An erosion model activity used by the St. Petersburg Coastal and Marine Science Center to showcase how hurricane-force winds can cause damage to coastal environments.
An erosion model activity used by the St. Petersburg Coastal and Marine Science Center to showcase how hurricane-force winds can cause damage to coastal environments.

SQUID-5 test near the St. Pete Pier
The SQUID-5, or Structure-from-motion (SfM) Quantitative Underwater Imaging Device with 5 cameras test in Tampa Bay.
The SQUID-5, or Structure-from-motion (SfM) Quantitative Underwater Imaging Device with 5 cameras test in Tampa Bay.

Dr. Legna Torres-García conducts an erosion model activity
Dr. Legna Torres-García conducts an erosion model activityDr. Legna Torres-García conducts an erosion model activity at the LCC Day School in St. Petersburg, FL, to showcase how hurricane-force winds can cause damage to coastal environments.

SQUID-5 deployment in Tampa Bay
The SQUID-5, or Structure-from-motion (SfM) Quantitative Underwater Imaging Device with 5 cameras, being deployed by Mitch Lemon (SPCMSC, on the left) and Gerry Hatcher (PCMSC, on the right) in Tampa Bay for testing.
The SQUID-5, or Structure-from-motion (SfM) Quantitative Underwater Imaging Device with 5 cameras, being deployed by Mitch Lemon (SPCMSC, on the left) and Gerry Hatcher (PCMSC, on the right) in Tampa Bay for testing.

Dr. Legna Torres-García conducts outreach
Dr. Legna Torres-García conducts an erosion model activity at the LCC Day School in St. Petersburg, FL, to showcase how hurricane-force winds can cause damage to coastal environments.
Dr. Legna Torres-García conducts an erosion model activity at the LCC Day School in St. Petersburg, FL, to showcase how hurricane-force winds can cause damage to coastal environments.

SQUID-5 being prepped for a test run
The SQUID-5, or Structure-from-motion (SfM) Quantitative Underwater Imaging Device with 5 cameras, shown being staged for a test run at the St. Petersburg Coastal and Marine Science Center. In the background, Andy Farmer (SPCMSC) and Gerry Hatcher (PCMSC) prep the R/V Sallenger, the vessel being used to tow the device.
The SQUID-5, or Structure-from-motion (SfM) Quantitative Underwater Imaging Device with 5 cameras, shown being staged for a test run at the St. Petersburg Coastal and Marine Science Center. In the background, Andy Farmer (SPCMSC) and Gerry Hatcher (PCMSC) prep the R/V Sallenger, the vessel being used to tow the device.

R/V Weatherbird II in port
The R/V Weatherbird II docked at the Florida Institute of Oceanography at University of South Florida (USF) College of Marine Science in St. Petersburg, Florida. USGS scientists and partners at Eckerd College and USF load the vessel in preparation for a research cruise as part of a National Science Foundation (NSF)-funded Scientists-at-Sea program.
The R/V Weatherbird II docked at the Florida Institute of Oceanography at University of South Florida (USF) College of Marine Science in St. Petersburg, Florida. USGS scientists and partners at Eckerd College and USF load the vessel in preparation for a research cruise as part of a National Science Foundation (NSF)-funded Scientists-at-Sea program.

Sub-bottom surveying at Seven Mile Island, New Jersey
Sub-bottom surveying at Seven Mile Island, New JerseyA floating sled that enables sub‐bottom surveying in shallow water, nearshore, and shore‐face environments. The sled is equipped with an EdgeTech SB‐512i chirp system and single‐beam sonar. This equipment is used to collect seismic sub‐bottom profiles and single‐beam bathymetry.