



Let's Get Technical: Water Levels
This webpage provides a technical description of how water levels are defined and calculated during a coastal storm event (such as a hurricane). It describes how the USGS team calculates the peak water level against which a reference beach complex is modeled in order to determine risks.
This page is part of an eight-page series on coastal storm-impact regimes, or storm-impact scale. It builds on the overview page How Storm-Impact Regimes Affect Beach Complexes: Coastal Hazards, continues with two other "Let's Get Technical" deep dives (Beach Complex and Dunes & Beach Metrics), and four pages describing the storm-impact regimes (Swash, Collision, Overwash, and Inundation). You can explore the full set through the linked text or the clickable tiles at the bottom of this page.
Overview
We suggest reading How Storm-Impact Regimes Affect Beach Complexes: Coastal Hazards overview page, and the Let’s Get Technical: Beach Complex and Let’s Get Technical: Dunes & Beach Metrics before this one. Those other pages touch on the concepts discussed here, but this page focuses specifically on how water levels are calculated within the predictive model and how that calculated water level is used against the dune base, dune toe and beach slope reference points to determine the storm impact scale a beach will experience during a storm event. As such, this is the most technical page on this topic, as it includes discussion of the models used and a breakdown of mathematical calculations.
Estimates of storm-induced water levels, mean water level, and total water level, are necessary for predicting the potential coastal change during an approaching storm (e.g., a hurricane).
Mean water level is an effective still-water level during a storm and is composed of the astronomical tide, storm surge and wave setup. Total water level is the maximum instantaneous water-level elevation expected during a storm and includes the astronomical tide, storm surge, and wave runup (which is wave setup + swash and is described in more depth below).
The difference between them is essentially the swash component that accounts for an additional elevation in water level only when referenced to a beach and is a key factor in determining the storm impact regime, particularly when the regime transitions to collision. Note that water levels can be calculated for a coastal system at any time, but these webpages are specifically addressing storm-induced scenarios.
Astronomical Tide (ηtide)
The astronomical tides refer to changes in coastal water level driven by the influence of gravity and centrifugal force from the moon and sun acting on the Earth’s oceans. The influence of tidal forcing leads to a displacement of coastal water levels in a largely predictable manner (ηtide). Since this is both relatively easy to predict and a regular occurrence that is monitored by thousands of stations around the world, our predictive model does not need to calculate tide; this data is brought in from NOAA calculations.
Storm Surge (ηsurge)
Storm surge is the temporary rise in water level due primarily to wind direction and magnitude within the storm, speed of the storm, size of the storm, and minimum pressure at the eye of the storm. Depending on the exact USGS product, the surge used as the basis for water level can be variable. The predictive model utilizes the NOAA STOFS (Surge and Tide Operational Forecast System) model for normal or non-tropical conditions, while NOAA P-Surge is used for impacts from tropical cyclones.
The NOAA P-Surge model output is based on many simulations generated using the NOAA SLOSH (Sea, Lake, and Overland Surges from Hurricanes) model (Jelesnianski, 1992). An example of SLOSH output, a real-time forecast model for hurricane-induced water levels for the Gulf and Atlantic coasts, can be seen in Figure 2.

The simulations vary the size, intensity, and position of the forecast storm based on historic simulation errors and an assumption of normally distributed errors (Taylor and Glahn, 2008) to get estimates of storm surge elevation along a long section of coastline.
Application of P-Surge to our probabilistic coastal change model requires that one or more exceedance values be chosen to produce a deterministic surge value. For emergency management and evacuation decision-making, the 10 percent exceedance value of P-Surge is typically chosen, to provide a conservative, worst-case scenario (Penny et al., 2023a).
The P-Surge model does not incorporate astronomical tides, wave runup or setup; however, astronomical tides are incorporated into the final results (Houston and others, 1999). Effectively, what is reported as surge into our model is, in fact, ηsurge+ηtide. While the results are location-specific, accounting for local water depths, proximity to bays and rivers, and other factors, the results are accurate to ± 20% of the calculated value.
Wave Setup (ηsetup) and Mean Water Level (η50)
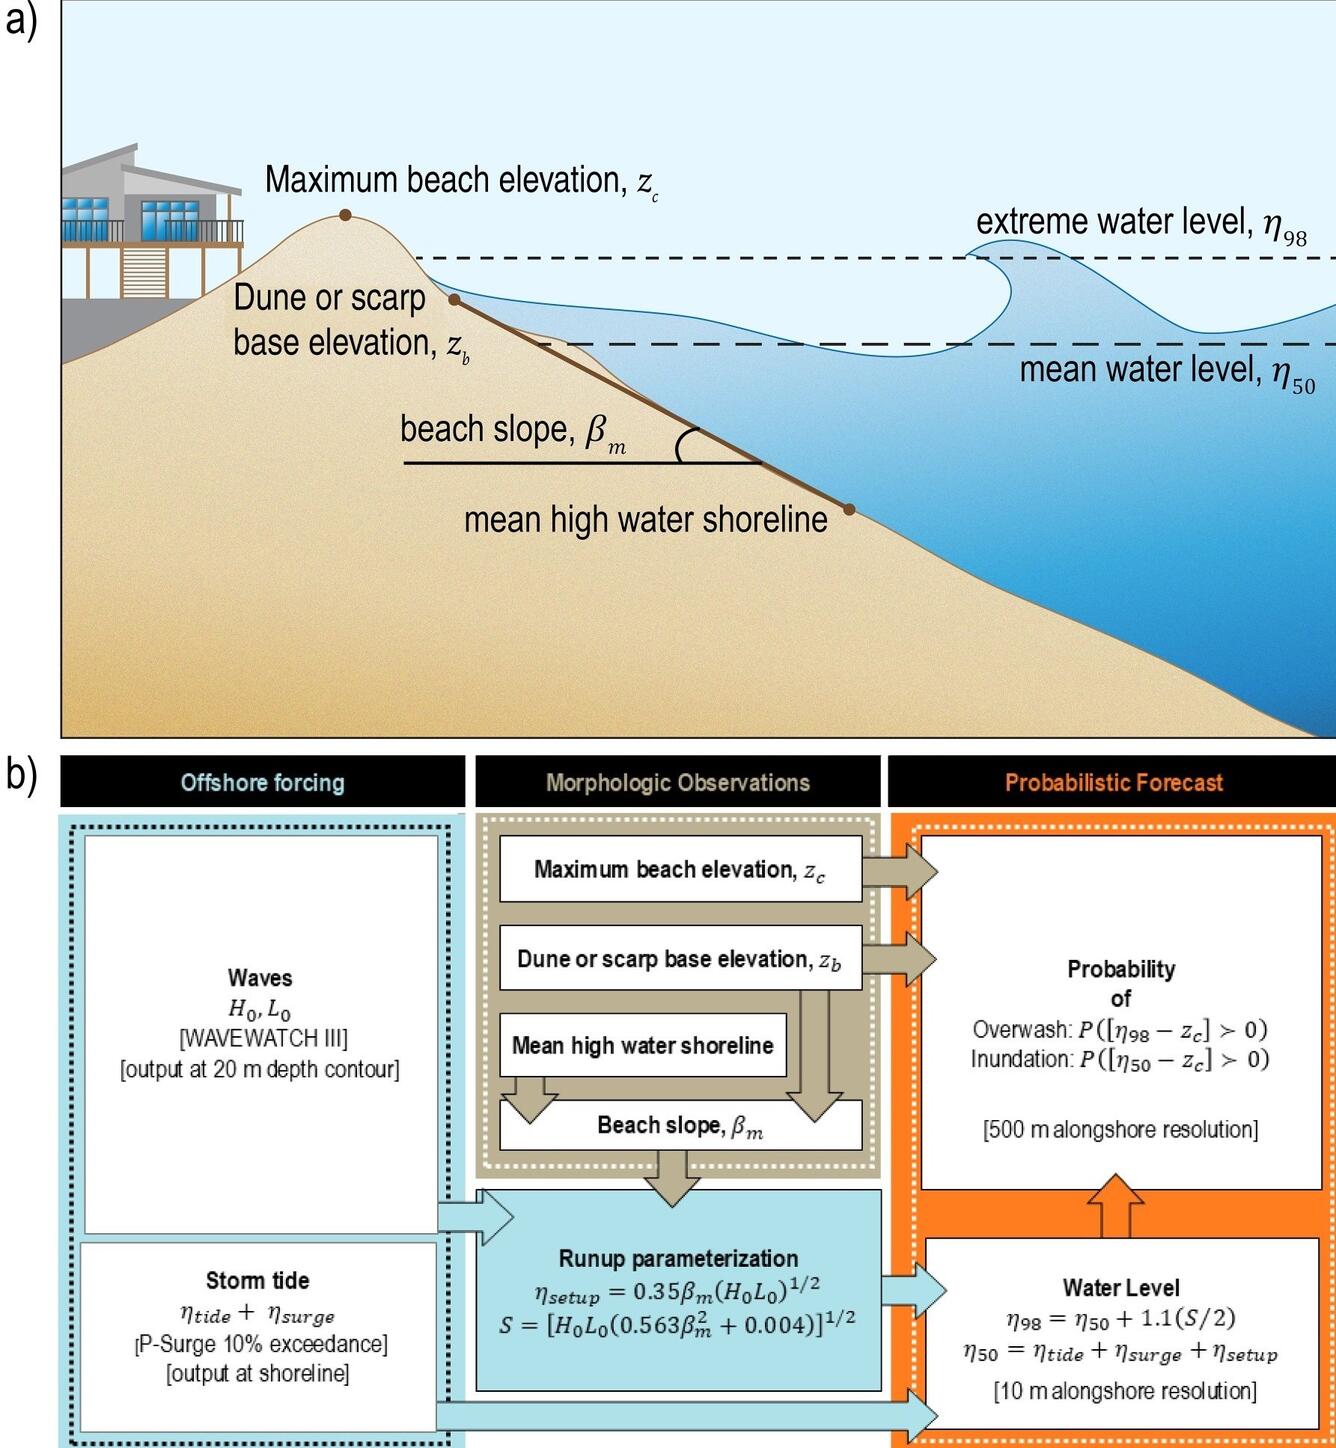
Wave setup is a displacement of water (ηsetup) at the shoreline due to wave breaking. Beach slope, wave height, and wavelength are all needed for the calculation. Wave setup elevates coastal water levels through a rule-of-thumb calculation (Figure 1b and Equation 1).
This elevation of the water level from setup is added to the influences of storm surge (ηsurge) and tides (ηtide) in order to calculate a mean water level (η50) that occurs at the beach at any given time (Figure 1b and Equation 2).
However, this calculation is still missing an important piece to accurately account for the total water level (η98). Both wave setup and wave runup (below) for our model are calculated based modeled wave conditions and beach slope (Stockdon et al., 2006).
Swash (S) and Wave Runup (ηrunup)
In addition to the impact that waves have on still-water levels through wave setup, after waves break, water will rush up the slope of the beachface in a process called wave swash (S). Sometimes, you may hear this referred to as uprush. It’s a process that is very easy to see while standing on a beach with waves and witnessing the water slide up the beach after a wave breaks. Swash can be calculated with an equation (also seen in Figure 1b; Equation 3). For the purposes of our probabilistic water level model; swash (S) is the difference between η50 and η98 (explained further down in this section).
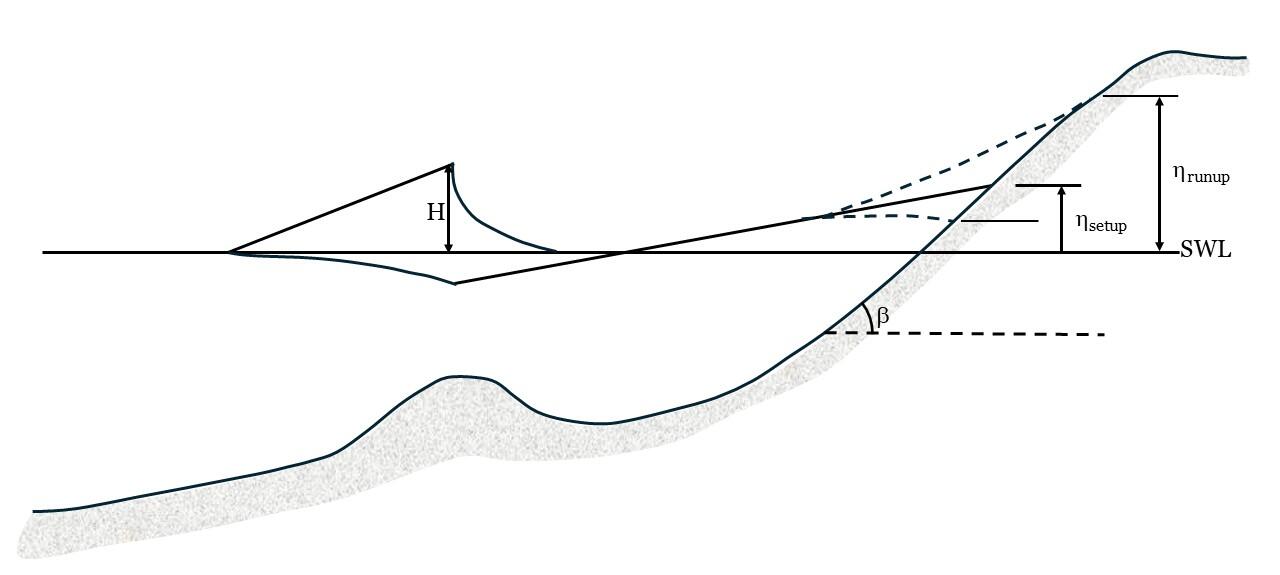
When the swash (S) calculation is combined with the wave setup (ηsetup) calculation, we can account for the fluctuation of water-level elevation over time due to wave activity; known as wave runup (Figure 3). In this way, wave runup is considered to include all the components of elevated water levels that could be attributed to wave activity. The amount of wave runup will be related to parameters of the wave height and deep-water wavelength (which is interdependent with period), but will also be greatly impacted by beach slope. The elevation of wave runup and setup is calculated from modeled offshore wave conditions using field-data-based empirical parameterizations (Stockdon and others, 2006). The wave runup parameterization requires local wave and beach slope information.
Total Water Level (η98)
The probabilistic water level model ultimately provides invaluable guidance on the maximum elevation that the water level will reach at local coasts. As described above, this is a complex problem that requires understanding water level contributions from tides, surge, and waves, and considering beach shape (dune crest, dune base, beach slope). Since the result is multiple sources of water levels integrated into a single number, we refer to the final output as Total Water Level (η98).
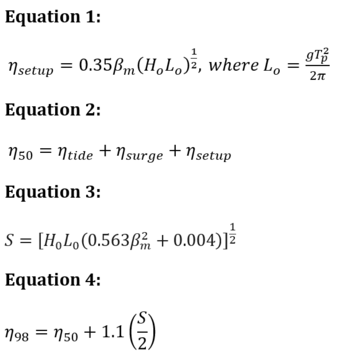
The key difference between η98 and η50 is the addition of the swash component so that wave setup can become wave runup. Verbally, we can describe total water level as the sum of swash (S) and mean water level (η50). Mathematically, we can describe total water level as seen in Equation 4.
When the total water level is forecasted for a beach of known slope, crest and base (as explained in Let’s Get Technical: Dunes & Beach Metrics), we can predict which storm impact regime that community will face (swash, collision, overwash, inundation) and provide actionable guidance for storm preparation.
Wave Data
Wave data for our model comes from the Nearshore Wave Prediction System (NWPS) run by National Oceanographic and Atmospheric Administration (NOAA). It is an operational implementation of the Simulating Waves Nearshore (SWAN) model. The NWPS coastal grids receive offshore boundary forcing from NOAA's National Centers for Environmental Prediction (NCEP) global wave model, WAVEWATCH III (WWIII).
Essentially, the offshore wave conditions are provided by NCEP running WWII, which creates the nearshore wave conditions for NWPS to run SWAN. Effects of wind generation are included using wind forcing developed by NWS forecasters at local Weather Forecast Offices (WFOs). The effects of time-varying water level due to tides and storm surge (described above) on wave transformation are incorporated.
The shape of the seafloor over which these waves are moving (called bathymetry) for wave simulations comes from the National Geophysical Data Center Digital Elevation Models. Wave information is extracted from the NWPS at ~500m (~1640 ft) resolution along the model grid at the point where water depth equals 20-m (called the 20m isobath) to provide estimates of H0 and L0.
During storm conditions, the wave runup can double the elevation of water levels at the coast beyond that due to storm surge alone. Without these parameters, an accurate depiction of storm water levels would be impossible, and therefore determining storm impact regime would be impossible. If storm surge models indicate a 10-foot storm surge, but leave out runup, the models will severely underpredict risk.
Recap:
Understanding the total water level (η98) experienced at the coast requires incorporation of water level contributions from tides (ηtide), surge (ηsurge), and waves (ηsetup, S, ηrunup). The tide predictions are well known and can be gathered from NOAA. The surge values are gathered from either STOFS (non-tropical event) or P-surge (tropical event). Wave components are gathered from the Nearshore Wave Prediction System with SWAN model runs nested in the nearshore of a WWIII offshore model run (maintained by NCEP).
These wave models form the basis of calculating wave setup and swash, which combined are referred to as wave runup. Once all these water levels are accounted for, the total water level is mathematically solved. The total water level is then predicted relative to the beach slope, dune base and dune crest to determine the storm impact regime.
Reference: Palmsten, M.L., Bendik, K.J., Doran, K.S., et al., 2026, Effects of storm surge exceedance value on overwash and inundation forecasts: Natural Hazards, v. 122, 600, https://doi.org/10.1007/s11069-026-08184-9.
The big picture and the science behind it: The overview introduces the topic; the "Let's Get Technical" pages cover the beach complex, dunes, and water levels in detail.
How Storm-Impact Regimes Affect Beach Complexes: Coastal Hazards - Overview
Let's Get Technical: Beach Complex
Let's Get Technical: Dunes & Beach Metrics
Let's Get Technical: Water Levels
How severe is a coastal storm? Explore the four storm-impact regimes of increasing severity, from swash to inundation.
Swash Regime
Collision Regime
Overwash Regime
Inundation Regime

Swash Regime

Overwash Regime
Collision Regime
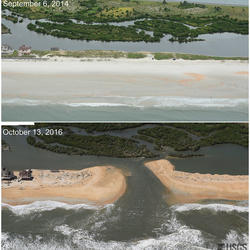
Inundation Regime

Let’s Get Technical: Beach Complex
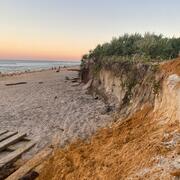
Let’s Get Technical: Dunes & Beach Metrics
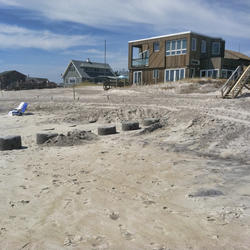
How Storm-Impact Regimes Affect Beach Complexes: Coastal Hazards

Storm-Induced Coastal Processes

National Coastal Change Hazards
This webpage provides a technical description of how water levels are defined and calculated during a coastal storm event (such as a hurricane). It describes how the USGS team calculates the peak water level against which a reference beach complex is modeled in order to determine risks.
This page is part of an eight-page series on coastal storm-impact regimes, or storm-impact scale. It builds on the overview page How Storm-Impact Regimes Affect Beach Complexes: Coastal Hazards, continues with two other "Let's Get Technical" deep dives (Beach Complex and Dunes & Beach Metrics), and four pages describing the storm-impact regimes (Swash, Collision, Overwash, and Inundation). You can explore the full set through the linked text or the clickable tiles at the bottom of this page.
Overview
We suggest reading How Storm-Impact Regimes Affect Beach Complexes: Coastal Hazards overview page, and the Let’s Get Technical: Beach Complex and Let’s Get Technical: Dunes & Beach Metrics before this one. Those other pages touch on the concepts discussed here, but this page focuses specifically on how water levels are calculated within the predictive model and how that calculated water level is used against the dune base, dune toe and beach slope reference points to determine the storm impact scale a beach will experience during a storm event. As such, this is the most technical page on this topic, as it includes discussion of the models used and a breakdown of mathematical calculations.
Estimates of storm-induced water levels, mean water level, and total water level, are necessary for predicting the potential coastal change during an approaching storm (e.g., a hurricane).
Mean water level is an effective still-water level during a storm and is composed of the astronomical tide, storm surge and wave setup. Total water level is the maximum instantaneous water-level elevation expected during a storm and includes the astronomical tide, storm surge, and wave runup (which is wave setup + swash and is described in more depth below).
The difference between them is essentially the swash component that accounts for an additional elevation in water level only when referenced to a beach and is a key factor in determining the storm impact regime, particularly when the regime transitions to collision. Note that water levels can be calculated for a coastal system at any time, but these webpages are specifically addressing storm-induced scenarios.
Astronomical Tide (ηtide)
The astronomical tides refer to changes in coastal water level driven by the influence of gravity and centrifugal force from the moon and sun acting on the Earth’s oceans. The influence of tidal forcing leads to a displacement of coastal water levels in a largely predictable manner (ηtide). Since this is both relatively easy to predict and a regular occurrence that is monitored by thousands of stations around the world, our predictive model does not need to calculate tide; this data is brought in from NOAA calculations.
Storm Surge (ηsurge)
Storm surge is the temporary rise in water level due primarily to wind direction and magnitude within the storm, speed of the storm, size of the storm, and minimum pressure at the eye of the storm. Depending on the exact USGS product, the surge used as the basis for water level can be variable. The predictive model utilizes the NOAA STOFS (Surge and Tide Operational Forecast System) model for normal or non-tropical conditions, while NOAA P-Surge is used for impacts from tropical cyclones.
The NOAA P-Surge model output is based on many simulations generated using the NOAA SLOSH (Sea, Lake, and Overland Surges from Hurricanes) model (Jelesnianski, 1992). An example of SLOSH output, a real-time forecast model for hurricane-induced water levels for the Gulf and Atlantic coasts, can be seen in Figure 2.
The simulations vary the size, intensity, and position of the forecast storm based on historic simulation errors and an assumption of normally distributed errors (Taylor and Glahn, 2008) to get estimates of storm surge elevation along a long section of coastline.
Application of P-Surge to our probabilistic coastal change model requires that one or more exceedance values be chosen to produce a deterministic surge value. For emergency management and evacuation decision-making, the 10 percent exceedance value of P-Surge is typically chosen, to provide a conservative, worst-case scenario (Penny et al., 2023a).
The P-Surge model does not incorporate astronomical tides, wave runup or setup; however, astronomical tides are incorporated into the final results (Houston and others, 1999). Effectively, what is reported as surge into our model is, in fact, ηsurge+ηtide. While the results are location-specific, accounting for local water depths, proximity to bays and rivers, and other factors, the results are accurate to ± 20% of the calculated value.
Wave Setup (ηsetup) and Mean Water Level (η50)
Wave setup is a displacement of water (ηsetup) at the shoreline due to wave breaking. Beach slope, wave height, and wavelength are all needed for the calculation. Wave setup elevates coastal water levels through a rule-of-thumb calculation (Figure 1b and Equation 1).
This elevation of the water level from setup is added to the influences of storm surge (ηsurge) and tides (ηtide) in order to calculate a mean water level (η50) that occurs at the beach at any given time (Figure 1b and Equation 2).
However, this calculation is still missing an important piece to accurately account for the total water level (η98). Both wave setup and wave runup (below) for our model are calculated based modeled wave conditions and beach slope (Stockdon et al., 2006).
Swash (S) and Wave Runup (ηrunup)
In addition to the impact that waves have on still-water levels through wave setup, after waves break, water will rush up the slope of the beachface in a process called wave swash (S). Sometimes, you may hear this referred to as uprush. It’s a process that is very easy to see while standing on a beach with waves and witnessing the water slide up the beach after a wave breaks. Swash can be calculated with an equation (also seen in Figure 1b; Equation 3). For the purposes of our probabilistic water level model; swash (S) is the difference between η50 and η98 (explained further down in this section).
When the swash (S) calculation is combined with the wave setup (ηsetup) calculation, we can account for the fluctuation of water-level elevation over time due to wave activity; known as wave runup (Figure 3). In this way, wave runup is considered to include all the components of elevated water levels that could be attributed to wave activity. The amount of wave runup will be related to parameters of the wave height and deep-water wavelength (which is interdependent with period), but will also be greatly impacted by beach slope. The elevation of wave runup and setup is calculated from modeled offshore wave conditions using field-data-based empirical parameterizations (Stockdon and others, 2006). The wave runup parameterization requires local wave and beach slope information.
Total Water Level (η98)
The probabilistic water level model ultimately provides invaluable guidance on the maximum elevation that the water level will reach at local coasts. As described above, this is a complex problem that requires understanding water level contributions from tides, surge, and waves, and considering beach shape (dune crest, dune base, beach slope). Since the result is multiple sources of water levels integrated into a single number, we refer to the final output as Total Water Level (η98).
The key difference between η98 and η50 is the addition of the swash component so that wave setup can become wave runup. Verbally, we can describe total water level as the sum of swash (S) and mean water level (η50). Mathematically, we can describe total water level as seen in Equation 4.
When the total water level is forecasted for a beach of known slope, crest and base (as explained in Let’s Get Technical: Dunes & Beach Metrics), we can predict which storm impact regime that community will face (swash, collision, overwash, inundation) and provide actionable guidance for storm preparation.
Wave Data
Wave data for our model comes from the Nearshore Wave Prediction System (NWPS) run by National Oceanographic and Atmospheric Administration (NOAA). It is an operational implementation of the Simulating Waves Nearshore (SWAN) model. The NWPS coastal grids receive offshore boundary forcing from NOAA's National Centers for Environmental Prediction (NCEP) global wave model, WAVEWATCH III (WWIII).
Essentially, the offshore wave conditions are provided by NCEP running WWII, which creates the nearshore wave conditions for NWPS to run SWAN. Effects of wind generation are included using wind forcing developed by NWS forecasters at local Weather Forecast Offices (WFOs). The effects of time-varying water level due to tides and storm surge (described above) on wave transformation are incorporated.
The shape of the seafloor over which these waves are moving (called bathymetry) for wave simulations comes from the National Geophysical Data Center Digital Elevation Models. Wave information is extracted from the NWPS at ~500m (~1640 ft) resolution along the model grid at the point where water depth equals 20-m (called the 20m isobath) to provide estimates of H0 and L0.
During storm conditions, the wave runup can double the elevation of water levels at the coast beyond that due to storm surge alone. Without these parameters, an accurate depiction of storm water levels would be impossible, and therefore determining storm impact regime would be impossible. If storm surge models indicate a 10-foot storm surge, but leave out runup, the models will severely underpredict risk.
Recap:
Understanding the total water level (η98) experienced at the coast requires incorporation of water level contributions from tides (ηtide), surge (ηsurge), and waves (ηsetup, S, ηrunup). The tide predictions are well known and can be gathered from NOAA. The surge values are gathered from either STOFS (non-tropical event) or P-surge (tropical event). Wave components are gathered from the Nearshore Wave Prediction System with SWAN model runs nested in the nearshore of a WWIII offshore model run (maintained by NCEP).
These wave models form the basis of calculating wave setup and swash, which combined are referred to as wave runup. Once all these water levels are accounted for, the total water level is mathematically solved. The total water level is then predicted relative to the beach slope, dune base and dune crest to determine the storm impact regime.
Reference: Palmsten, M.L., Bendik, K.J., Doran, K.S., et al., 2026, Effects of storm surge exceedance value on overwash and inundation forecasts: Natural Hazards, v. 122, 600, https://doi.org/10.1007/s11069-026-08184-9.
The big picture and the science behind it: The overview introduces the topic; the "Let's Get Technical" pages cover the beach complex, dunes, and water levels in detail.
How Storm-Impact Regimes Affect Beach Complexes: Coastal Hazards - Overview
Let's Get Technical: Beach Complex
Let's Get Technical: Dunes & Beach Metrics
Let's Get Technical: Water Levels
How severe is a coastal storm? Explore the four storm-impact regimes of increasing severity, from swash to inundation.
Swash Regime
Collision Regime
Overwash Regime
Inundation Regime
Swash Regime
Overwash Regime
Collision Regime
Inundation Regime
Let’s Get Technical: Beach Complex
Let’s Get Technical: Dunes & Beach Metrics
How Storm-Impact Regimes Affect Beach Complexes: Coastal Hazards
Storm-Induced Coastal Processes