



Let’s Get Technical: Dunes & Beach Metrics
This webpage provides technical details regarding how the USGS calculates beach metrics related to morphology features; specifically, the dune crest position and elevation, the dune base/toe position and elevation and beach slope. This is a brief overview of that process with links and references to the full source material.
This page is part of an eight-page series on coastal storm-impact regimes, or storm-impact scale. It builds on the overview page How Storm-Impact Regimes Affect Beach Complexes: Coastal Hazards, continues with two other "Let's Get Technical" deep dives (Beach Complex and Water Levels), and four pages describing the storm-impact regimes (Swash, Collision, Overwash, and Inundation). You can explore the full set through the linked text or the clickable tiles at the bottom of this page. We suggest reading the How Storm-Impact Regimes Affect Beach Complexes: Coastal Hazards overview and the Let’s Get Technical: Beach Complex pages first.
Overview
The vulnerability of a beach complex to a storm-impact regime (collision, overwash, or inundation) is heavily influenced by the highest point on the beach complex. On a natural beach system, this is either the first dune ridge, or in the absence of a dune, the beach berm.
For areas that have been heavily engineered with coastal protection (e.g., seawalls), the top of the structure is used. In addition, researchers need to identify the dune base position and the beach slope. Finding these markers for the highest points and human structures across extensive beach areas is extremely time consuming to do in person.
This page describes the methods by which the dune crest (or highest point of a beach) and dune base are calculated using remotely sensed data combined with in-situ verification.
Measuring the dune crest and dune base
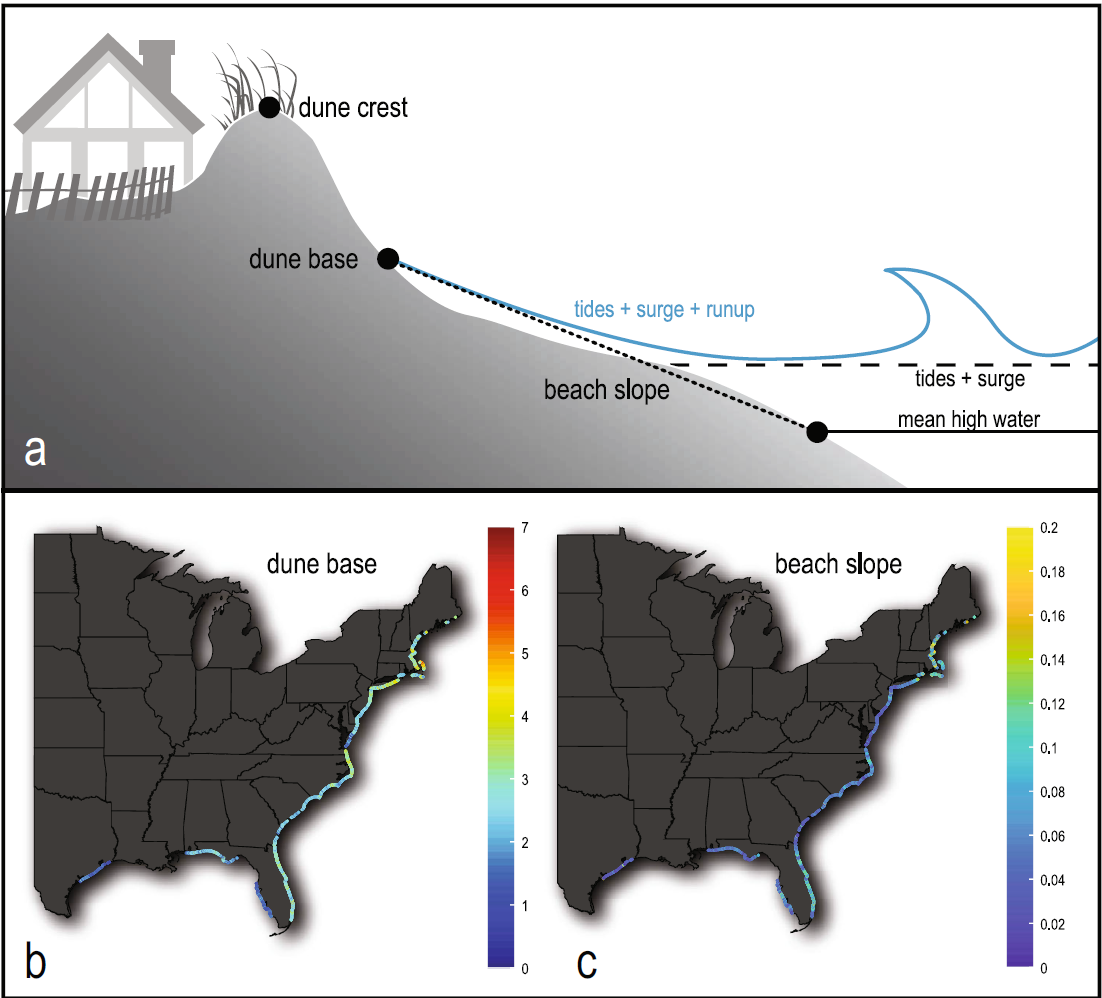
In order for the predictive model to determine the storm impact regime, highly accurate information about the shape of the beach complex is required. Researchers need the position of the dune crest, the dune base, and the beach slope for large areas of coast. The USGS developed a method to extract the full beach system, including the dune, from lidar data collected by the USGS and U.S. Army Corps of Engineers (Stockdon et al., 2012). Extracting the slope of the beach is relatively easy with the data: it is calculated between the mean high water and extracted dune base (see Stockdon et al., 2012, for full explanation and additional references).
The lidar data is gridded into a three-dimensional surface recreating the shape of the beach complex at a vertical accuracy of 15 centimeters (~6 inches). The resultant grid generated by the fixed-scale interpolator also allowed for creation of a horizontal spatial grid with shore-parallel resolution of 10 meters (~33 feet) and shore-perpendicular resolution of 2.5 m (~8 feet). A secondary output of this gridding process produces a root mean square (RMS) error grid. The RMS error grid allows researchers to determine how noisy their data is. To smooth the data edges, researchers apply a Hanning filter at two times the grid resolution. This process accounts for vegetation and other error sources while preserving the data frequency.
To find the dune crest, the lidar data is gridded to recreate the shape of the beach complex at an accuracy of 15 cm (~6 inches). That data is then post-processed to minimize the signal noise of vegetation. The result is a full recreation of the beach complex at alongshore intervals of approximately 10 meters (~33 feet) and a shore perpendicular resolution of 2.5 m (~ 8 feet). The data is further processed to remove vegetation and other sources of error. The most elevated spot in the system (either the primary dune crest, a protective structure or the berm crest) is then calculated from the processed lidar data calculated at the same 10 m (~33 feet) lateral interval, utilizing a complex algorithm (Figure 2; Stockdon et al., 2009). Aerial images of the beaches are then used to help verify the position of the dune crest.
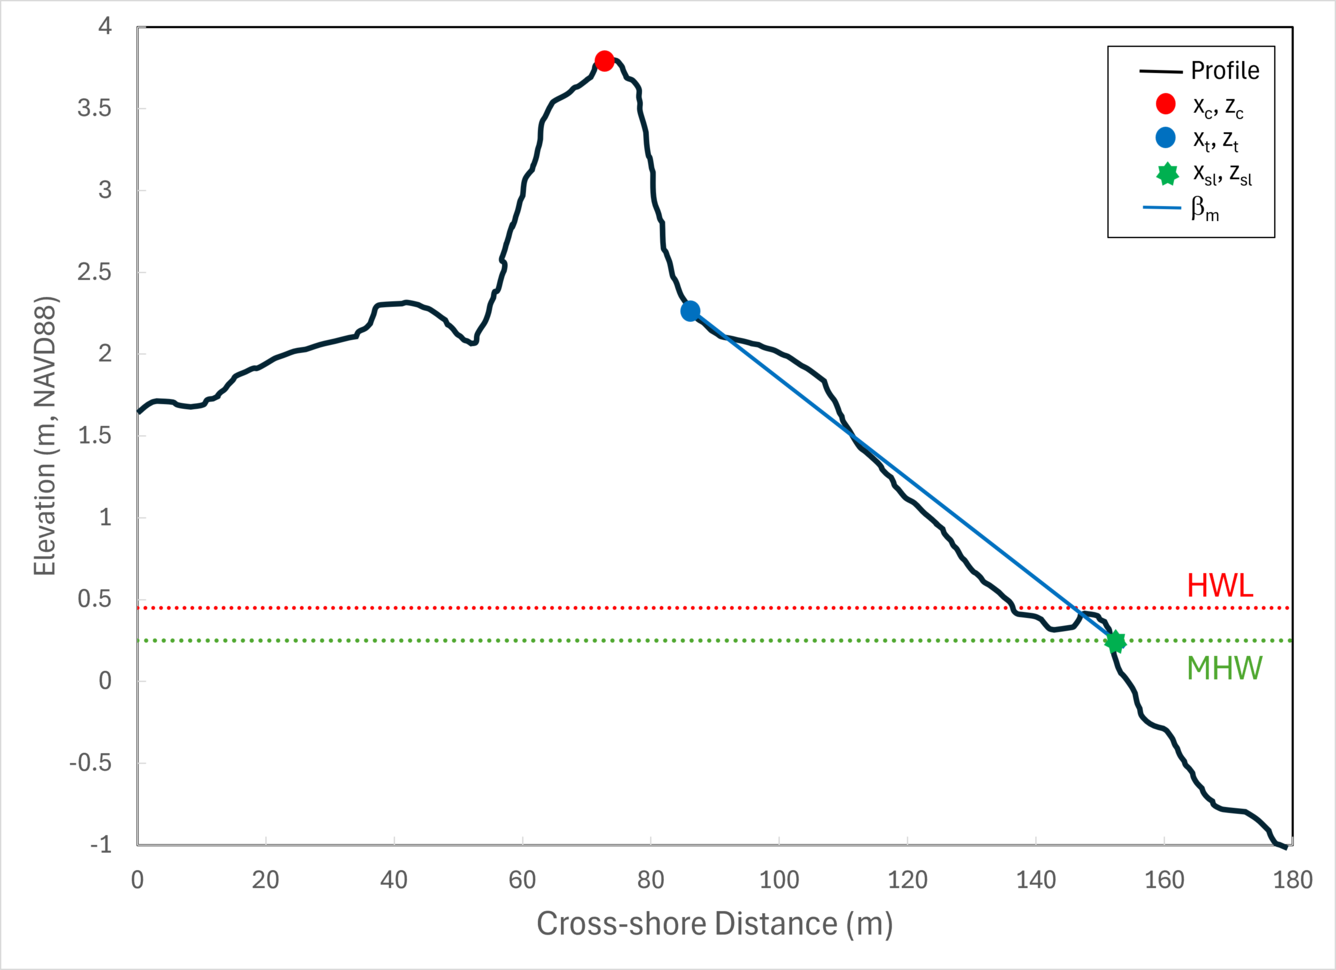
Extracting the dune base is also important for predicting the possible storm-impact regimes, particularly collision, which is defined as erosion of the dune base. The first step of this process was to successfully identify the mean high water so wind-driven dune formation processes could be differentiated from ocean-driven beach and berm formation processes. The water elevation calculations include tides and wave runup, based on 20-year means of wave parameters (height and peak period). The dune base is ultimately defined as the point of maximum slope change between the highest point on the beach complex and mean high water. Aerial imagery was then used to verify the position of the dune base relative to mean high water, just like the dune crest process (Figure 2; Stockdon et al., 2012).
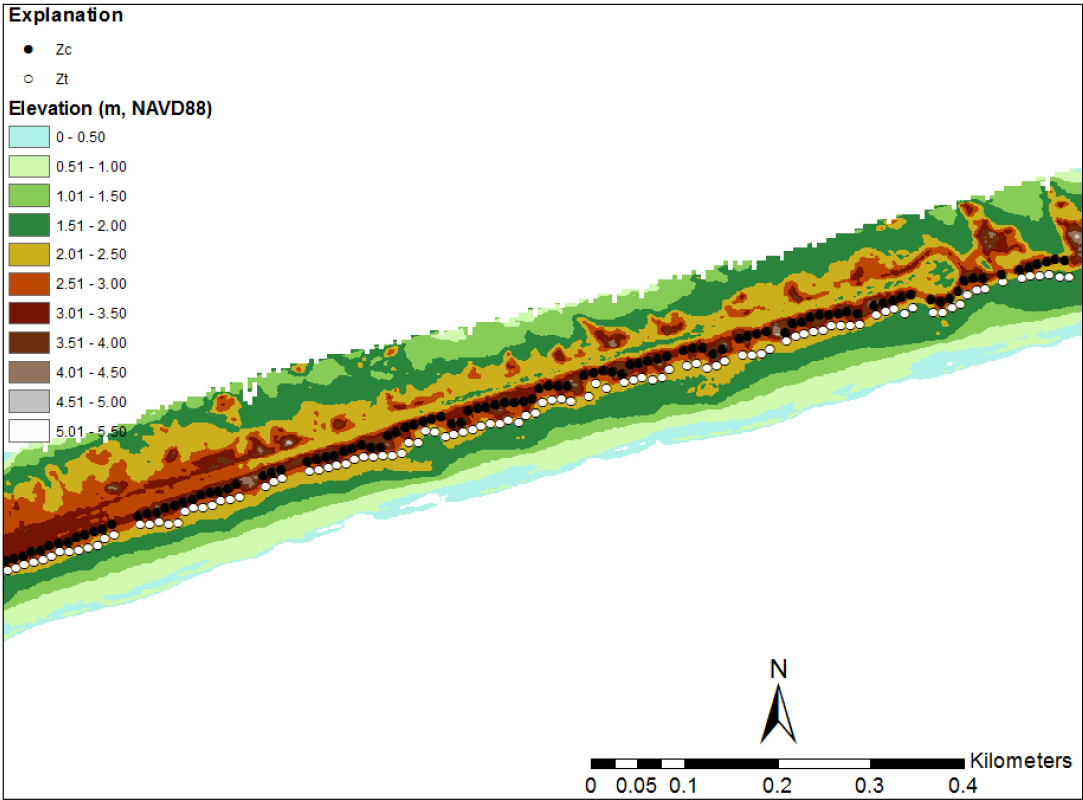
Once the dune crest, dune base, mean high water, and beach shapes are extracted from the lidar, individual 10-m-spaced transects depicting the cross-shore beach complex are generated (Figure 3). With the beach complex fully developed, the next set of calculations relates to changing water levels during storm events, and can be explored in the Let’s Get Technical: Water Levels page.
The big picture and the science behind it: The overview introduces the topic; the "Let's Get Technical" pages cover the beach complex, dunes, and water levels in detail.
How Storm-Impact Regimes Affect Beach Complexes: Coastal Hazards - Overview
Let's Get Technical: Beach Complex
Let's Get Technical: Dunes & Beach Metrics
Let's Get Technical: Water Levels
How severe is a coastal storm? Explore the four storm-impact regimes of increasing severity, from swash to inundation.
Swash Regime
Collision Regime
Overwash Regime
Inundation Regime

Swash Regime

Overwash Regime
Collision Regime
Inundation Regime

Let’s Get Technical: Beach Complex

Let's Get Technical: Water Levels
How Storm-Impact Regimes Affect Beach Complexes: Coastal Hazards

Storm-Induced Coastal Change
This webpage provides technical details regarding how the USGS calculates beach metrics related to morphology features; specifically, the dune crest position and elevation, the dune base/toe position and elevation and beach slope. This is a brief overview of that process with links and references to the full source material.
This page is part of an eight-page series on coastal storm-impact regimes, or storm-impact scale. It builds on the overview page How Storm-Impact Regimes Affect Beach Complexes: Coastal Hazards, continues with two other "Let's Get Technical" deep dives (Beach Complex and Water Levels), and four pages describing the storm-impact regimes (Swash, Collision, Overwash, and Inundation). You can explore the full set through the linked text or the clickable tiles at the bottom of this page. We suggest reading the How Storm-Impact Regimes Affect Beach Complexes: Coastal Hazards overview and the Let’s Get Technical: Beach Complex pages first.
Overview
The vulnerability of a beach complex to a storm-impact regime (collision, overwash, or inundation) is heavily influenced by the highest point on the beach complex. On a natural beach system, this is either the first dune ridge, or in the absence of a dune, the beach berm.
For areas that have been heavily engineered with coastal protection (e.g., seawalls), the top of the structure is used. In addition, researchers need to identify the dune base position and the beach slope. Finding these markers for the highest points and human structures across extensive beach areas is extremely time consuming to do in person.
This page describes the methods by which the dune crest (or highest point of a beach) and dune base are calculated using remotely sensed data combined with in-situ verification.
Measuring the dune crest and dune base
In order for the predictive model to determine the storm impact regime, highly accurate information about the shape of the beach complex is required. Researchers need the position of the dune crest, the dune base, and the beach slope for large areas of coast. The USGS developed a method to extract the full beach system, including the dune, from lidar data collected by the USGS and U.S. Army Corps of Engineers (Stockdon et al., 2012). Extracting the slope of the beach is relatively easy with the data: it is calculated between the mean high water and extracted dune base (see Stockdon et al., 2012, for full explanation and additional references).
The lidar data is gridded into a three-dimensional surface recreating the shape of the beach complex at a vertical accuracy of 15 centimeters (~6 inches). The resultant grid generated by the fixed-scale interpolator also allowed for creation of a horizontal spatial grid with shore-parallel resolution of 10 meters (~33 feet) and shore-perpendicular resolution of 2.5 m (~8 feet). A secondary output of this gridding process produces a root mean square (RMS) error grid. The RMS error grid allows researchers to determine how noisy their data is. To smooth the data edges, researchers apply a Hanning filter at two times the grid resolution. This process accounts for vegetation and other error sources while preserving the data frequency.
To find the dune crest, the lidar data is gridded to recreate the shape of the beach complex at an accuracy of 15 cm (~6 inches). That data is then post-processed to minimize the signal noise of vegetation. The result is a full recreation of the beach complex at alongshore intervals of approximately 10 meters (~33 feet) and a shore perpendicular resolution of 2.5 m (~ 8 feet). The data is further processed to remove vegetation and other sources of error. The most elevated spot in the system (either the primary dune crest, a protective structure or the berm crest) is then calculated from the processed lidar data calculated at the same 10 m (~33 feet) lateral interval, utilizing a complex algorithm (Figure 2; Stockdon et al., 2009). Aerial images of the beaches are then used to help verify the position of the dune crest.
Extracting the dune base is also important for predicting the possible storm-impact regimes, particularly collision, which is defined as erosion of the dune base. The first step of this process was to successfully identify the mean high water so wind-driven dune formation processes could be differentiated from ocean-driven beach and berm formation processes. The water elevation calculations include tides and wave runup, based on 20-year means of wave parameters (height and peak period). The dune base is ultimately defined as the point of maximum slope change between the highest point on the beach complex and mean high water. Aerial imagery was then used to verify the position of the dune base relative to mean high water, just like the dune crest process (Figure 2; Stockdon et al., 2012).
Once the dune crest, dune base, mean high water, and beach shapes are extracted from the lidar, individual 10-m-spaced transects depicting the cross-shore beach complex are generated (Figure 3). With the beach complex fully developed, the next set of calculations relates to changing water levels during storm events, and can be explored in the Let’s Get Technical: Water Levels page.
The big picture and the science behind it: The overview introduces the topic; the "Let's Get Technical" pages cover the beach complex, dunes, and water levels in detail.
How Storm-Impact Regimes Affect Beach Complexes: Coastal Hazards - Overview
Let's Get Technical: Beach Complex
Let's Get Technical: Dunes & Beach Metrics
Let's Get Technical: Water Levels
How severe is a coastal storm? Explore the four storm-impact regimes of increasing severity, from swash to inundation.
Swash Regime
Collision Regime
Overwash Regime
Inundation Regime
Swash Regime
Overwash Regime
Collision Regime
Inundation Regime
Let’s Get Technical: Beach Complex
Let's Get Technical: Water Levels
How Storm-Impact Regimes Affect Beach Complexes: Coastal Hazards