



Tuff Cliff, located north of Madison Junction in Yellowstone National Park, is one of the best-known exposures of the Lava Creek Tuff and has long been cited as a classic example of member A of that deposit. USGS photo by Mike Poland, September 24, 2026.
Images
Volcano Science Center images.
Filter Total Items: 621
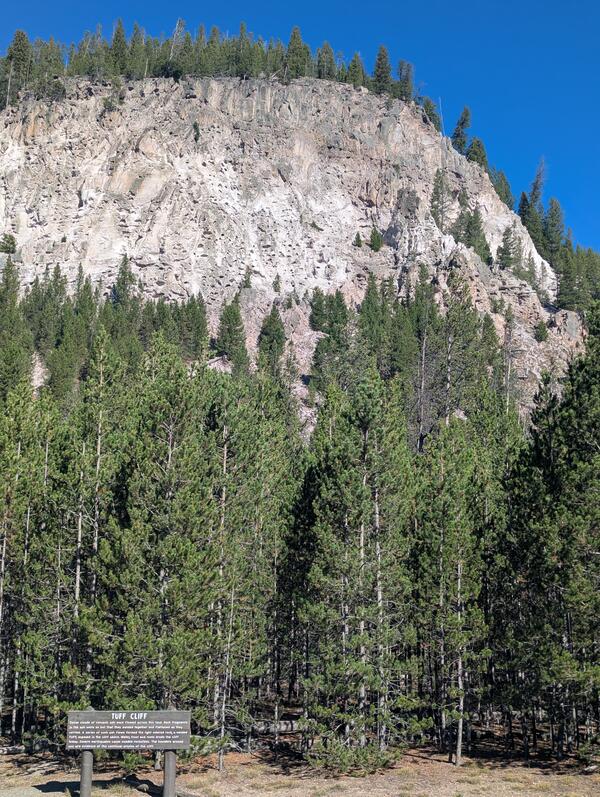
Tuff Cliff, in Yellowstone National Park
Tuff Cliff, located north of Madison Junction in Yellowstone National Park, is one of the best-known exposures of the Lava Creek Tuff and has long been cited as a classic example of member A of that deposit. USGS photo by Mike Poland, September 24, 2026.
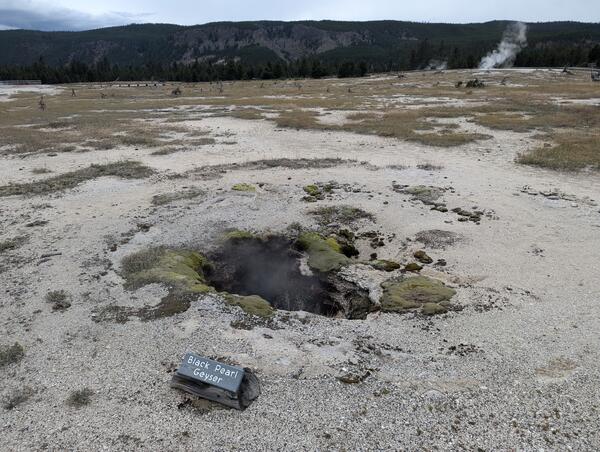
Black Pearl Geyser, Biscuit Basin, Yellowstone National Park
Black Pearl Geyser, Biscuit Basin, Yellowstone National ParkBlack Pearl Geyser in Biscuit Basin, Upper Geyser Basin, Yellowstone National Park. USGS photo by Mike Poland, September 22, 2026.
Black Pearl Geyser, Biscuit Basin, Yellowstone National Park
Black Pearl Geyser, Biscuit Basin, Yellowstone National ParkBlack Pearl Geyser in Biscuit Basin, Upper Geyser Basin, Yellowstone National Park. USGS photo by Mike Poland, September 22, 2026.
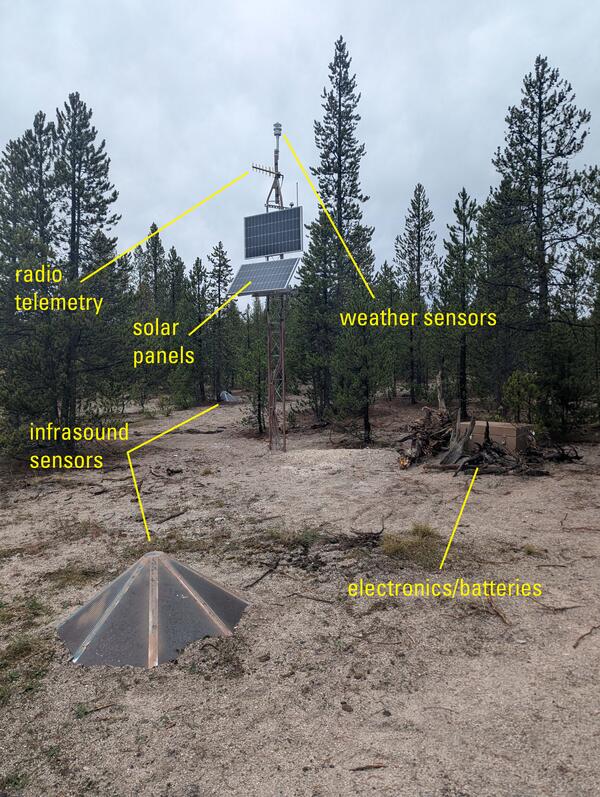
YGH monitoring station in Yellowstone National Park
YGH monitoring station in Yellowstone National ParkYGH monitoring station near Geyser Hill, Upper Geyser Basin, Yellowstone National Park. Infrasound sensors sit under the brown "hats" that serve as wind screens, and a seismometer is buried nearby.
YGH monitoring station in Yellowstone National Park
YGH monitoring station in Yellowstone National ParkYGH monitoring station near Geyser Hill, Upper Geyser Basin, Yellowstone National Park. Infrasound sensors sit under the brown "hats" that serve as wind screens, and a seismometer is buried nearby.
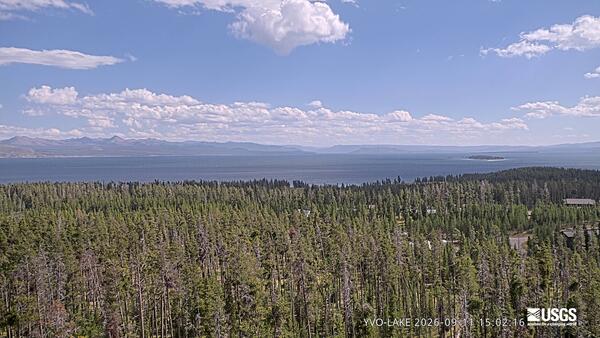
View of Yellowstone Lake from the 2026 edition of the Lake camera
View of Yellowstone Lake from the 2026 edition of the Lake cameraView from September 11, 2026, at 3:02:16 p.m.
View of Yellowstone Lake from the 2026 edition of the Lake camera
View of Yellowstone Lake from the 2026 edition of the Lake cameraView from September 11, 2026, at 3:02:16 p.m.
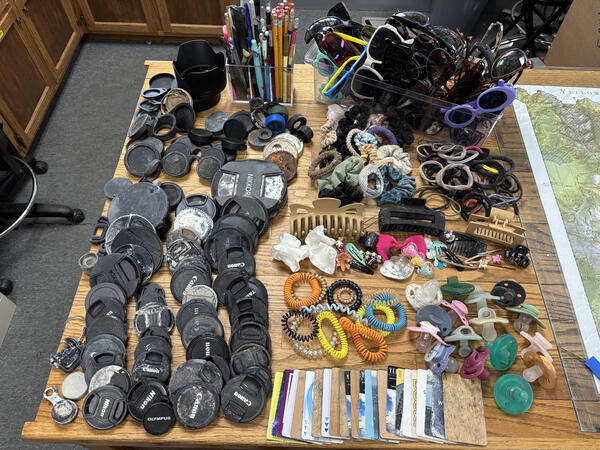
Frequent finds collected in summer 2026 by the Yellowstone National Park Geology Team
Frequent finds collected in summer 2026 by the Yellowstone National Park Geology TeamFrequent finds collected by the Yellowstone National Park Geology Team from hydrothermal areas during the summer season in 2026: camera lens covers and binocular parts, pens and pencils, sunglasses, hair accessories, hotel keys, and more! National Park Service photo by Margery Price, September 2026.
Frequent finds collected in summer 2026 by the Yellowstone National Park Geology Team
Frequent finds collected in summer 2026 by the Yellowstone National Park Geology TeamFrequent finds collected by the Yellowstone National Park Geology Team from hydrothermal areas during the summer season in 2026: camera lens covers and binocular parts, pens and pencils, sunglasses, hair accessories, hotel keys, and more! National Park Service photo by Margery Price, September 2026.
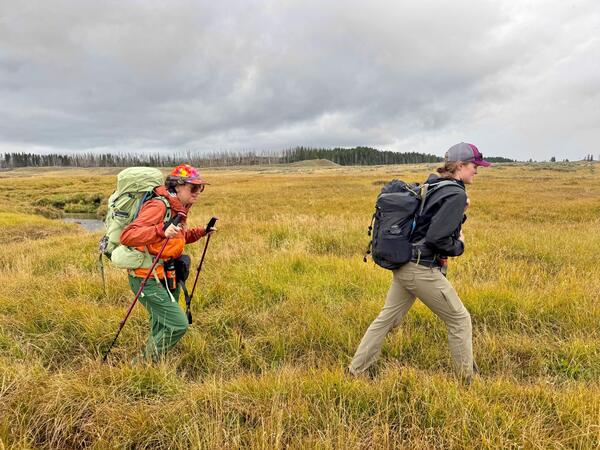
EarthScope field engineers hike to a GPS station in Hayden Valley, Yellowstone National Park
EarthScope field engineers hike to a GPS station in Hayden Valley, Yellowstone National ParkEarthScope intern Lexi Kenis (left) and field engineer Lia Lajoie (right) hike through Hayden Valley in Yellowstone National Park on their way to GPS Station HVWY. Photo by Brendan Hodge, EarthScope Consortium, September 2026.
EarthScope field engineers hike to a GPS station in Hayden Valley, Yellowstone National Park
EarthScope field engineers hike to a GPS station in Hayden Valley, Yellowstone National ParkEarthScope intern Lexi Kenis (left) and field engineer Lia Lajoie (right) hike through Hayden Valley in Yellowstone National Park on their way to GPS Station HVWY. Photo by Brendan Hodge, EarthScope Consortium, September 2026.
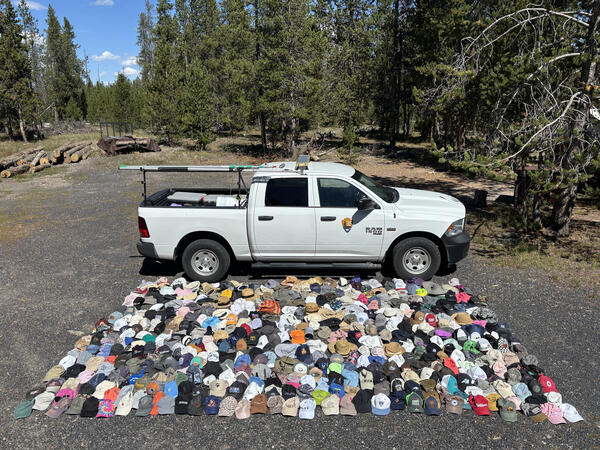
Hats collected in summer 2026 by the Yellowstone National Park Geology Team
Hats collected in summer 2026 by the Yellowstone National Park Geology TeamHats collected by the Yellowstone National Park Geology Team and other park staff from hydrothermal areas during the summer 2026 season (Geology Team truck for scale). National Park Service photo by Margery Price, September 2026.
Hats collected in summer 2026 by the Yellowstone National Park Geology Team
Hats collected in summer 2026 by the Yellowstone National Park Geology TeamHats collected by the Yellowstone National Park Geology Team and other park staff from hydrothermal areas during the summer 2026 season (Geology Team truck for scale). National Park Service photo by Margery Price, September 2026.
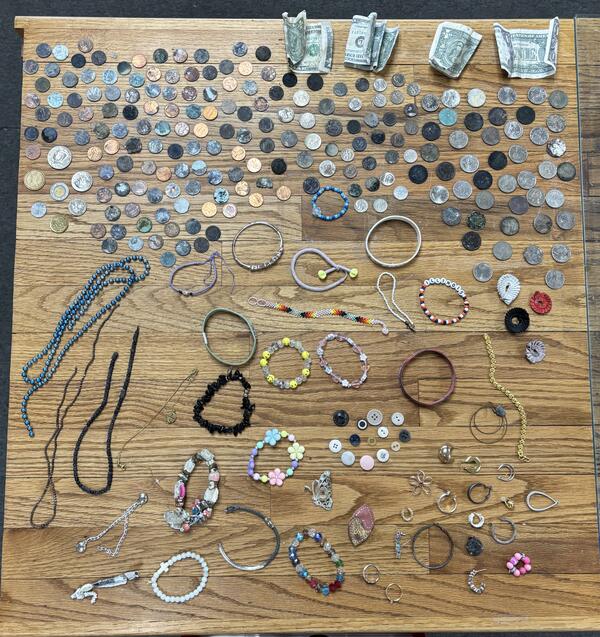
Coins, bills, and jewelry collected in summer 2026 by the Yellowstone National Park Geology Team
Coins, bills, and jewelry collected in summer 2026 by the Yellowstone National Park Geology TeamCoins, bills, and jewelry collected by the Yellowstone National Park Geology Team from hydrothermal areas during the summer season in 2026. National Park Service photo by Margery Price, September 2026.
Coins, bills, and jewelry collected in summer 2026 by the Yellowstone National Park Geology Team
Coins, bills, and jewelry collected in summer 2026 by the Yellowstone National Park Geology TeamCoins, bills, and jewelry collected by the Yellowstone National Park Geology Team from hydrothermal areas during the summer season in 2026. National Park Service photo by Margery Price, September 2026.
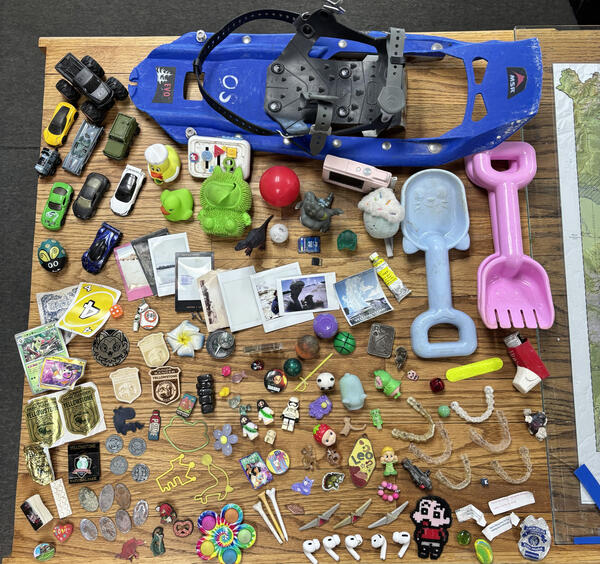
More bizarre Yellowstone National Park Geology Team finds from summer 2026
More bizarre Yellowstone National Park Geology Team finds from summer 2026More bizarre Yellowstone National Park Geology Team finds from hydrothermal areas during the 2026 summer season—including golf tees, fortune cookie fortunes, AirPods, rubber ducks, and Invisalign retainers! National Park Service photo by Margery Price, September 2026.
More bizarre Yellowstone National Park Geology Team finds from summer 2026
More bizarre Yellowstone National Park Geology Team finds from summer 2026More bizarre Yellowstone National Park Geology Team finds from hydrothermal areas during the 2026 summer season—including golf tees, fortune cookie fortunes, AirPods, rubber ducks, and Invisalign retainers! National Park Service photo by Margery Price, September 2026.
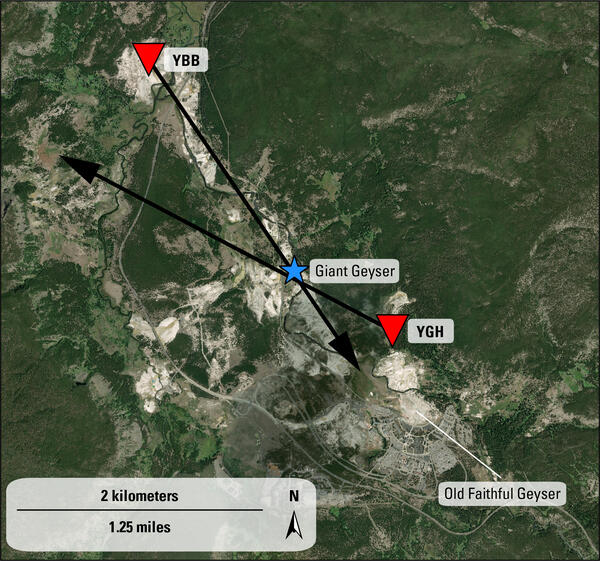
Backazimuth map showing infrasound directions that converge on Giant Geyser, Yellowstone National Park, when it erupted on September 10, 2026
Backazimuth map showing infrasound directions that converge on Giant Geyser, Yellowstone National Park, when it erupted on September 10, 2026Acoustic signals recorded at infrasound arrays (red inverted triangles) YBB (in Biscuit Basin) and YGH (near Geyser Hill), in Upper Geyser Basin, can be used to determine the direction from which low-frequency acoustic signals originated, also called the backazimuth. This example is from 9:14 p.m.
Backazimuth map showing infrasound directions that converge on Giant Geyser, Yellowstone National Park, when it erupted on September 10, 2026
Backazimuth map showing infrasound directions that converge on Giant Geyser, Yellowstone National Park, when it erupted on September 10, 2026Acoustic signals recorded at infrasound arrays (red inverted triangles) YBB (in Biscuit Basin) and YGH (near Geyser Hill), in Upper Geyser Basin, can be used to determine the direction from which low-frequency acoustic signals originated, also called the backazimuth. This example is from 9:14 p.m.
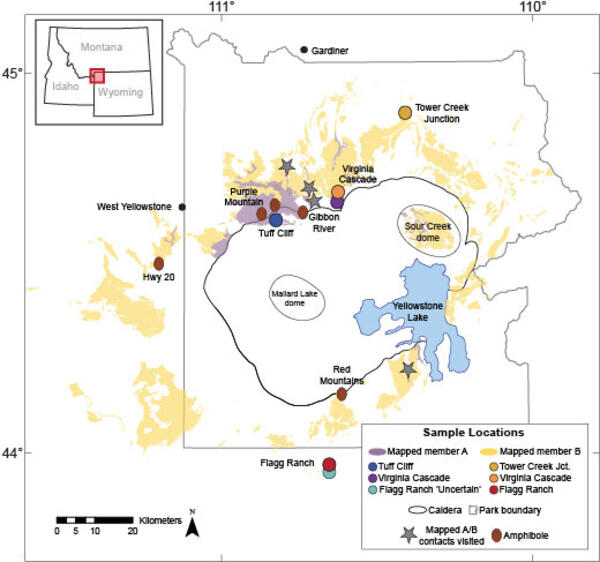
Map of Yellowstone National Park showing Lava Creek Tuff deposits and sample locations
Map of Yellowstone National Park showing Lava Creek Tuff deposits and sample locationsMap of Yellowstone National Park showing Lava Creek Tuff deposits and sample locations. Different colors indicate deposits traditionally assigned to member A (purple), member B (yellow), and the Sour Creek dome (green). Amphibole symbols mark locations where amphibole was identified.
Map of Yellowstone National Park showing Lava Creek Tuff deposits and sample locations
Map of Yellowstone National Park showing Lava Creek Tuff deposits and sample locationsMap of Yellowstone National Park showing Lava Creek Tuff deposits and sample locations. Different colors indicate deposits traditionally assigned to member A (purple), member B (yellow), and the Sour Creek dome (green). Amphibole symbols mark locations where amphibole was identified.
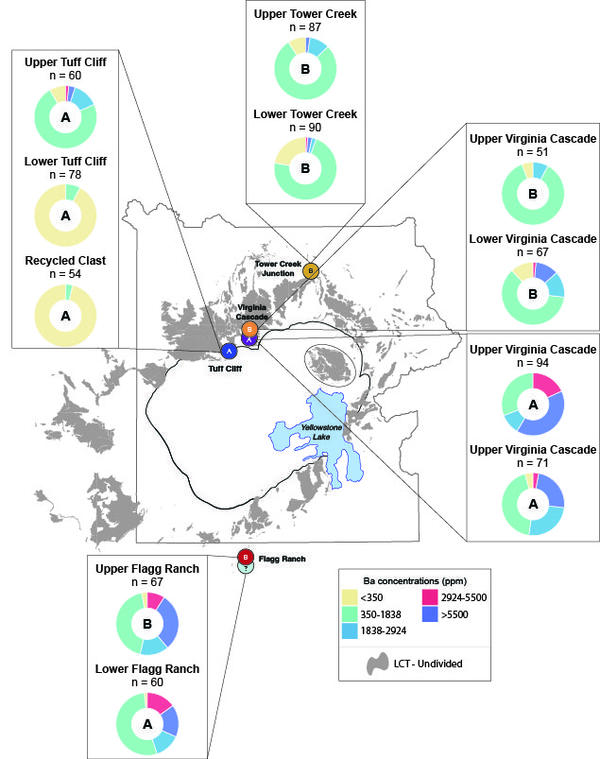
Locations of Lava Creek Tuff samples and their barium compositions in the Yellowstone National Park area
Locations of Lava Creek Tuff samples and their barium compositions in the Yellowstone National Park areaLocations of Lava Creek Tuff samples in the Yellowstone National Park area. Colored rings show the relative abundance of sanidine crystals with different barium (Ba) concentrations, measured in parts per million (ppm), at each site.
Locations of Lava Creek Tuff samples and their barium compositions in the Yellowstone National Park area
Locations of Lava Creek Tuff samples and their barium compositions in the Yellowstone National Park areaLocations of Lava Creek Tuff samples in the Yellowstone National Park area. Colored rings show the relative abundance of sanidine crystals with different barium (Ba) concentrations, measured in parts per million (ppm), at each site.
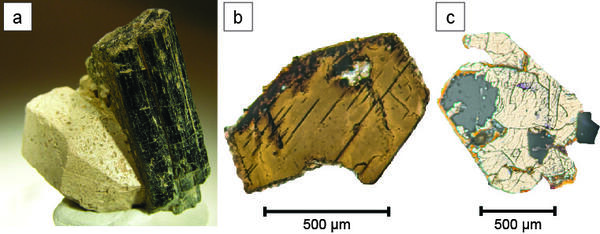
Amphibole, which is a mineral that had previously been used to distinguish Lava Creek Tuff (Yellowstone) members A and B.
Amphibole, which is a mineral that had previously been used to distinguish Lava Creek Tuff (Yellowstone) members A and B.Amphibole, which is a mineral that had previously been used to distinguish Lava Creek Tuff (Yellowstone) members A and B. (a) An amphibole crystal (photo: Rob Lavinsky, iRocks.com – CC-BY-SA-3.0). (b-c) Microscopic images of amphibole crystals from rocks previously assigned to Lava Creek Tuff Member A (b) and Member B (c).
Amphibole, which is a mineral that had previously been used to distinguish Lava Creek Tuff (Yellowstone) members A and B.
Amphibole, which is a mineral that had previously been used to distinguish Lava Creek Tuff (Yellowstone) members A and B.Amphibole, which is a mineral that had previously been used to distinguish Lava Creek Tuff (Yellowstone) members A and B. (a) An amphibole crystal (photo: Rob Lavinsky, iRocks.com – CC-BY-SA-3.0). (b-c) Microscopic images of amphibole crystals from rocks previously assigned to Lava Creek Tuff Member A (b) and Member B (c).
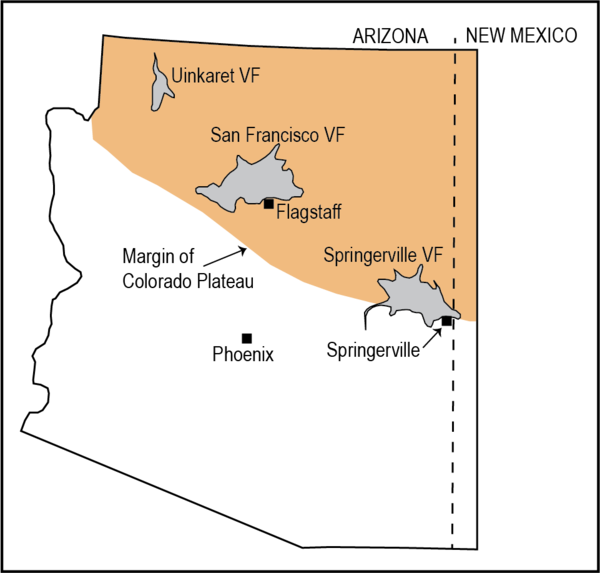
Simplified map showing Arizona volcanic fields in relation to eth Colorado Plateau
Simplified map showing Arizona volcanic fields in relation to eth Colorado PlateauSimplified map of Arizona and western edge of New Mexico, showing the location of the Uinkaret, San Francisco, and Springerville volcanic fields as shaded gray areas as well as the locations of Flagstaff, Springerville, and Phoenix for reference. The Colorado Plateau is shown in a light orange color.
Simplified map showing Arizona volcanic fields in relation to eth Colorado Plateau
Simplified map showing Arizona volcanic fields in relation to eth Colorado PlateauSimplified map of Arizona and western edge of New Mexico, showing the location of the Uinkaret, San Francisco, and Springerville volcanic fields as shaded gray areas as well as the locations of Flagstaff, Springerville, and Phoenix for reference. The Colorado Plateau is shown in a light orange color.
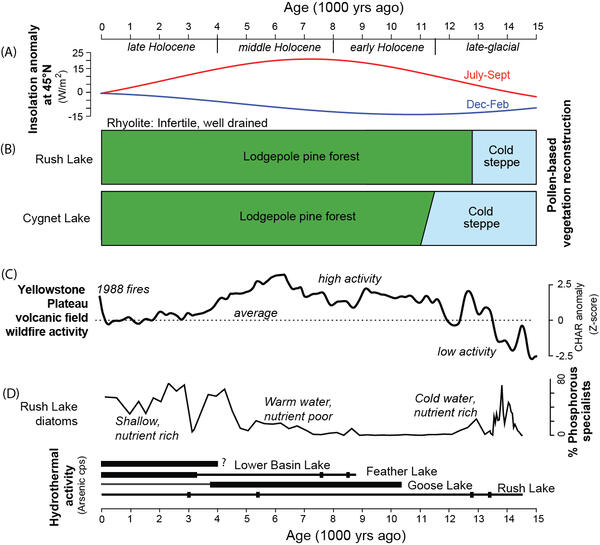
Climate records from Lower Geyser Basin, Yellowstone National Park, over the past 15,000 years
Climate records from Lower Geyser Basin, Yellowstone National Park, over the past 15,000 yearsComparison of changes in seasonal solar radiation (insolation) and the environmental history of Lower Geyser Basin (modified from Whitlock et al. 2026). (A) Insolation anomaly for summer and winter at 45 oN latitude. (B) Pollen-based vegetation reconstructions from Rush Lake (Lower Geyser Basin) and Cygnet Lake (Central Plateau).
Climate records from Lower Geyser Basin, Yellowstone National Park, over the past 15,000 years
Climate records from Lower Geyser Basin, Yellowstone National Park, over the past 15,000 yearsComparison of changes in seasonal solar radiation (insolation) and the environmental history of Lower Geyser Basin (modified from Whitlock et al. 2026). (A) Insolation anomaly for summer and winter at 45 oN latitude. (B) Pollen-based vegetation reconstructions from Rush Lake (Lower Geyser Basin) and Cygnet Lake (Central Plateau).
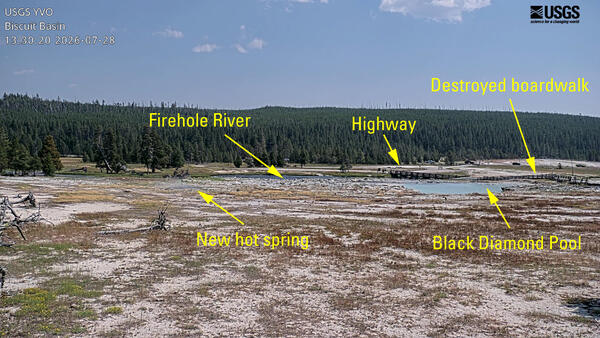
Camera view from Biscuit Basin monitoring site, Yellowstone National Park
Camera view from Biscuit Basin monitoring site, Yellowstone National ParkView from a research camera installed at Biscuit Basin near the site of seismic, infrasound, and GPS monitoring. The camera has a view of Black Diamond Pool, where a hydrothermal explosion occurred on July 23, 2024, as well as of the area north of the pool where another small explosion occurred on June 13, 2026. Camera images are updated every 15 minutes
Camera view from Biscuit Basin monitoring site, Yellowstone National Park
Camera view from Biscuit Basin monitoring site, Yellowstone National ParkView from a research camera installed at Biscuit Basin near the site of seismic, infrasound, and GPS monitoring. The camera has a view of Black Diamond Pool, where a hydrothermal explosion occurred on July 23, 2024, as well as of the area north of the pool where another small explosion occurred on June 13, 2026. Camera images are updated every 15 minutes
Camera installation at Biscuit Basin monitoring site, Yellowstone National Park
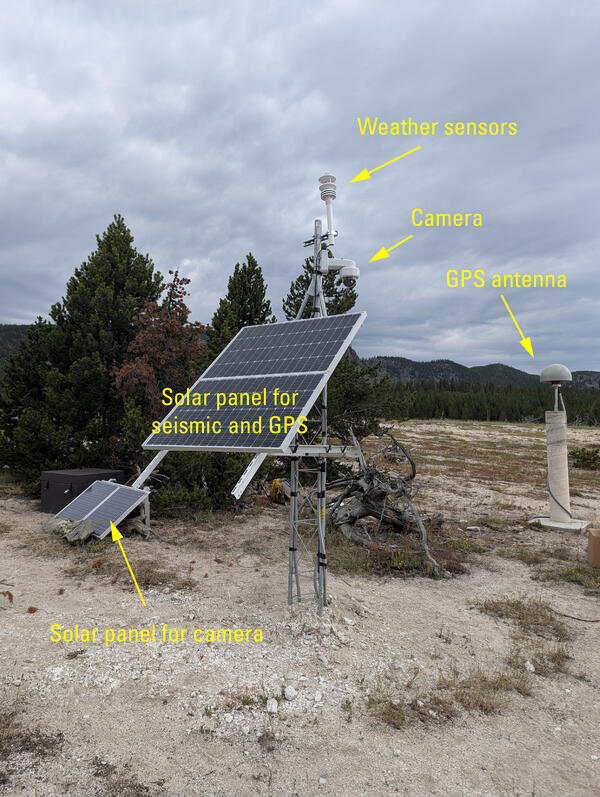
Camera installation at Biscuit Basin monitoring site, Yellowstone National ParkCamera installed at the Biscuit Basin monitoring site. The camera is near the top of a small tower that holds a weather sensor and solar panel that powers nearby seismic and acoustic sensors. The solar panel that powers the camera is located on the ground at the base of the tower. USGS photo by Mike Poland, July 22, 2026.
Camera installation at Biscuit Basin monitoring site, Yellowstone National Park
Camera installation at Biscuit Basin monitoring site, Yellowstone National ParkCamera installed at the Biscuit Basin monitoring site. The camera is near the top of a small tower that holds a weather sensor and solar panel that powers nearby seismic and acoustic sensors. The solar panel that powers the camera is located on the ground at the base of the tower. USGS photo by Mike Poland, July 22, 2026.
Black Sand Pool, Upper Geyser Basin, Yellowstone National Park
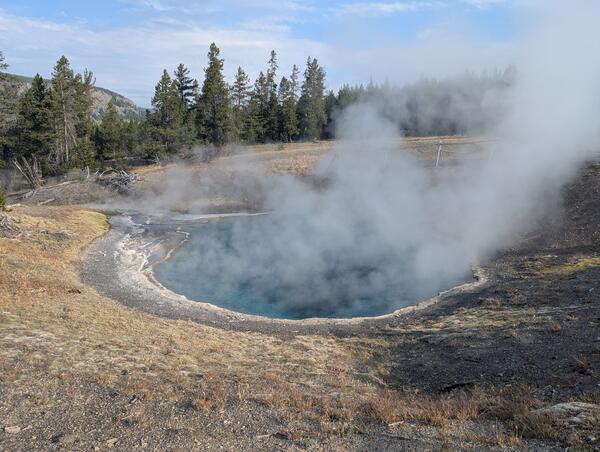
Black Sand Pool, Upper Geyser Basin, Yellowstone National ParkBlack Sand Pool, in Yellowstone National Park's Upper Geyser Basin. The hot spring is known for it's thumping behavior, which occurs every few minutes due to collapse of bubbles within the spring. The thumping is strong enough to be heard and felt by anyone nearby. USGS photo by Mike Poland, July 21, 2026.
Black Sand Pool, Upper Geyser Basin, Yellowstone National Park
Black Sand Pool, Upper Geyser Basin, Yellowstone National ParkBlack Sand Pool, in Yellowstone National Park's Upper Geyser Basin. The hot spring is known for it's thumping behavior, which occurs every few minutes due to collapse of bubbles within the spring. The thumping is strong enough to be heard and felt by anyone nearby. USGS photo by Mike Poland, July 21, 2026.
Satellite image of the eastern Snake River Plain, Idaho, showing locations of recent volcanic eruptions
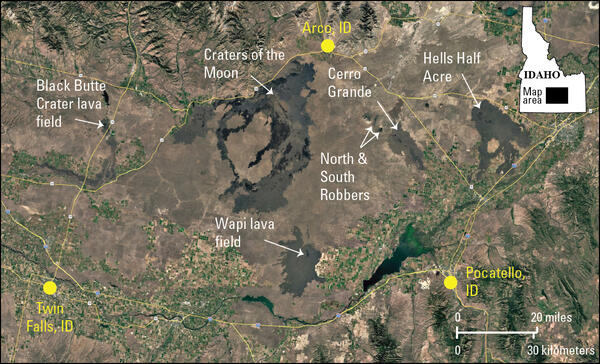
Satellite image of the eastern Snake River Plain, Idaho, showing locations of recent volcanic eruptionsGoogle Earth image of the newly proposed Idaho Volcanic Field, with recent eruptions indicated, and Craters of the Moon lava field. Major city centers surrounding the volcanic field are included to provide spatial context.
Satellite image of the eastern Snake River Plain, Idaho, showing locations of recent volcanic eruptions
Satellite image of the eastern Snake River Plain, Idaho, showing locations of recent volcanic eruptionsGoogle Earth image of the newly proposed Idaho Volcanic Field, with recent eruptions indicated, and Craters of the Moon lava field. Major city centers surrounding the volcanic field are included to provide spatial context.
Locations of new features associated with June 13, 2026, small hydrothermal explosion at Biscuit Basin, Yellowstone National Park
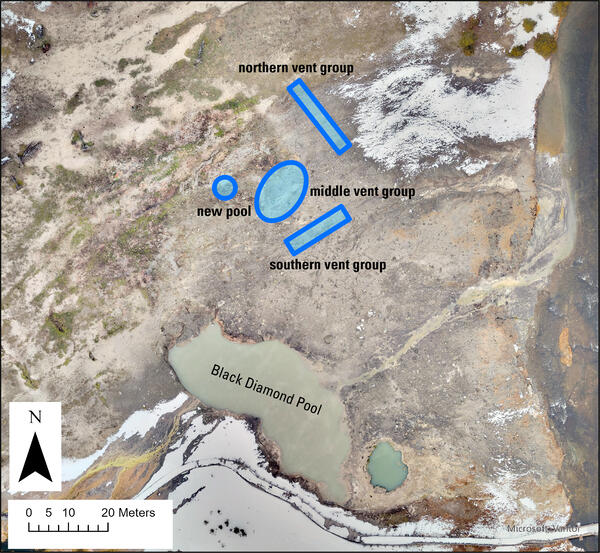
Locations of new features associated with June 13, 2026, small hydrothermal explosion at Biscuit Basin, Yellowstone National ParkAerial view of the Black Diamond Pool area of Biscuit Basin, Yellowstone National Park, showing the locations of northern, middle, and southern vent groups that formed as a result of a small hydrothermal explosion on June 13, 2026. The "new pool' developed later, between June 14 and 16.
Locations of new features associated with June 13, 2026, small hydrothermal explosion at Biscuit Basin, Yellowstone National Park
Locations of new features associated with June 13, 2026, small hydrothermal explosion at Biscuit Basin, Yellowstone National ParkAerial view of the Black Diamond Pool area of Biscuit Basin, Yellowstone National Park, showing the locations of northern, middle, and southern vent groups that formed as a result of a small hydrothermal explosion on June 13, 2026. The "new pool' developed later, between June 14 and 16.
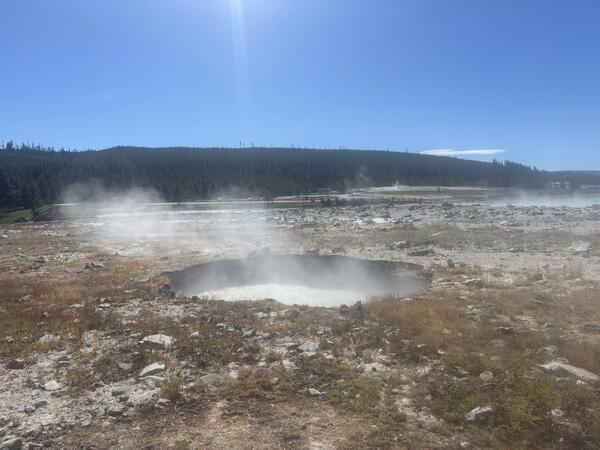
Pool of boiling water that formed via collapse a few days after the June 13, 2026, hydrothermal explosion at Biscuit Basin, Yellowstone National Park
Pool of boiling water that formed via collapse a few days after the June 13, 2026, hydrothermal explosion at Biscuit Basin, Yellowstone National ParkPool of boiling water that formed a few days after the June 13, 2026, hydrothermal explosion at Biscuit Basin, Yellowstone National Park, and that is located near the middle vent group of features that formed during the explosion. The pool is about 6.5 × 5.3 meters (21 × 17 feet) in size and formed via collapse based on the lack of surrounding ejecta.
Pool of boiling water that formed via collapse a few days after the June 13, 2026, hydrothermal explosion at Biscuit Basin, Yellowstone National Park
Pool of boiling water that formed via collapse a few days after the June 13, 2026, hydrothermal explosion at Biscuit Basin, Yellowstone National ParkPool of boiling water that formed a few days after the June 13, 2026, hydrothermal explosion at Biscuit Basin, Yellowstone National Park, and that is located near the middle vent group of features that formed during the explosion. The pool is about 6.5 × 5.3 meters (21 × 17 feet) in size and formed via collapse based on the lack of surrounding ejecta.