Montana State University researchers recording data at an outcrop in Yellowstone National Park
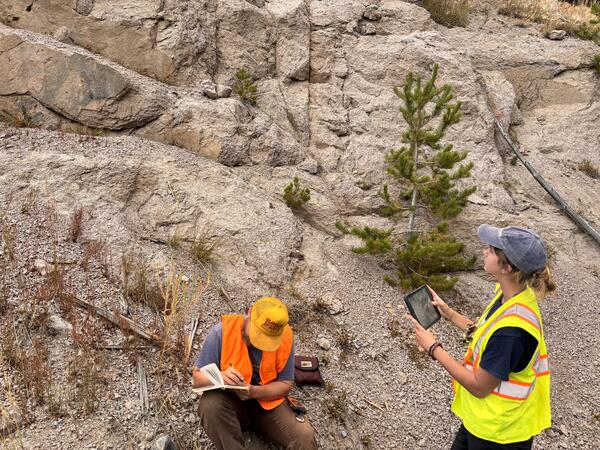
Montana State University researchers recording data at an outcrop in Yellowstone National ParkMontana State University researchers recording data at an outcrop in Yellowstone National Park. M.S. student Liv Wheeler (right) overlays the GPS position of the outcrop over a geologic map produced by USGS geologist Robert Christianson, while undergraduate student Liam Arnold (left) notes other data related to the outcrop.